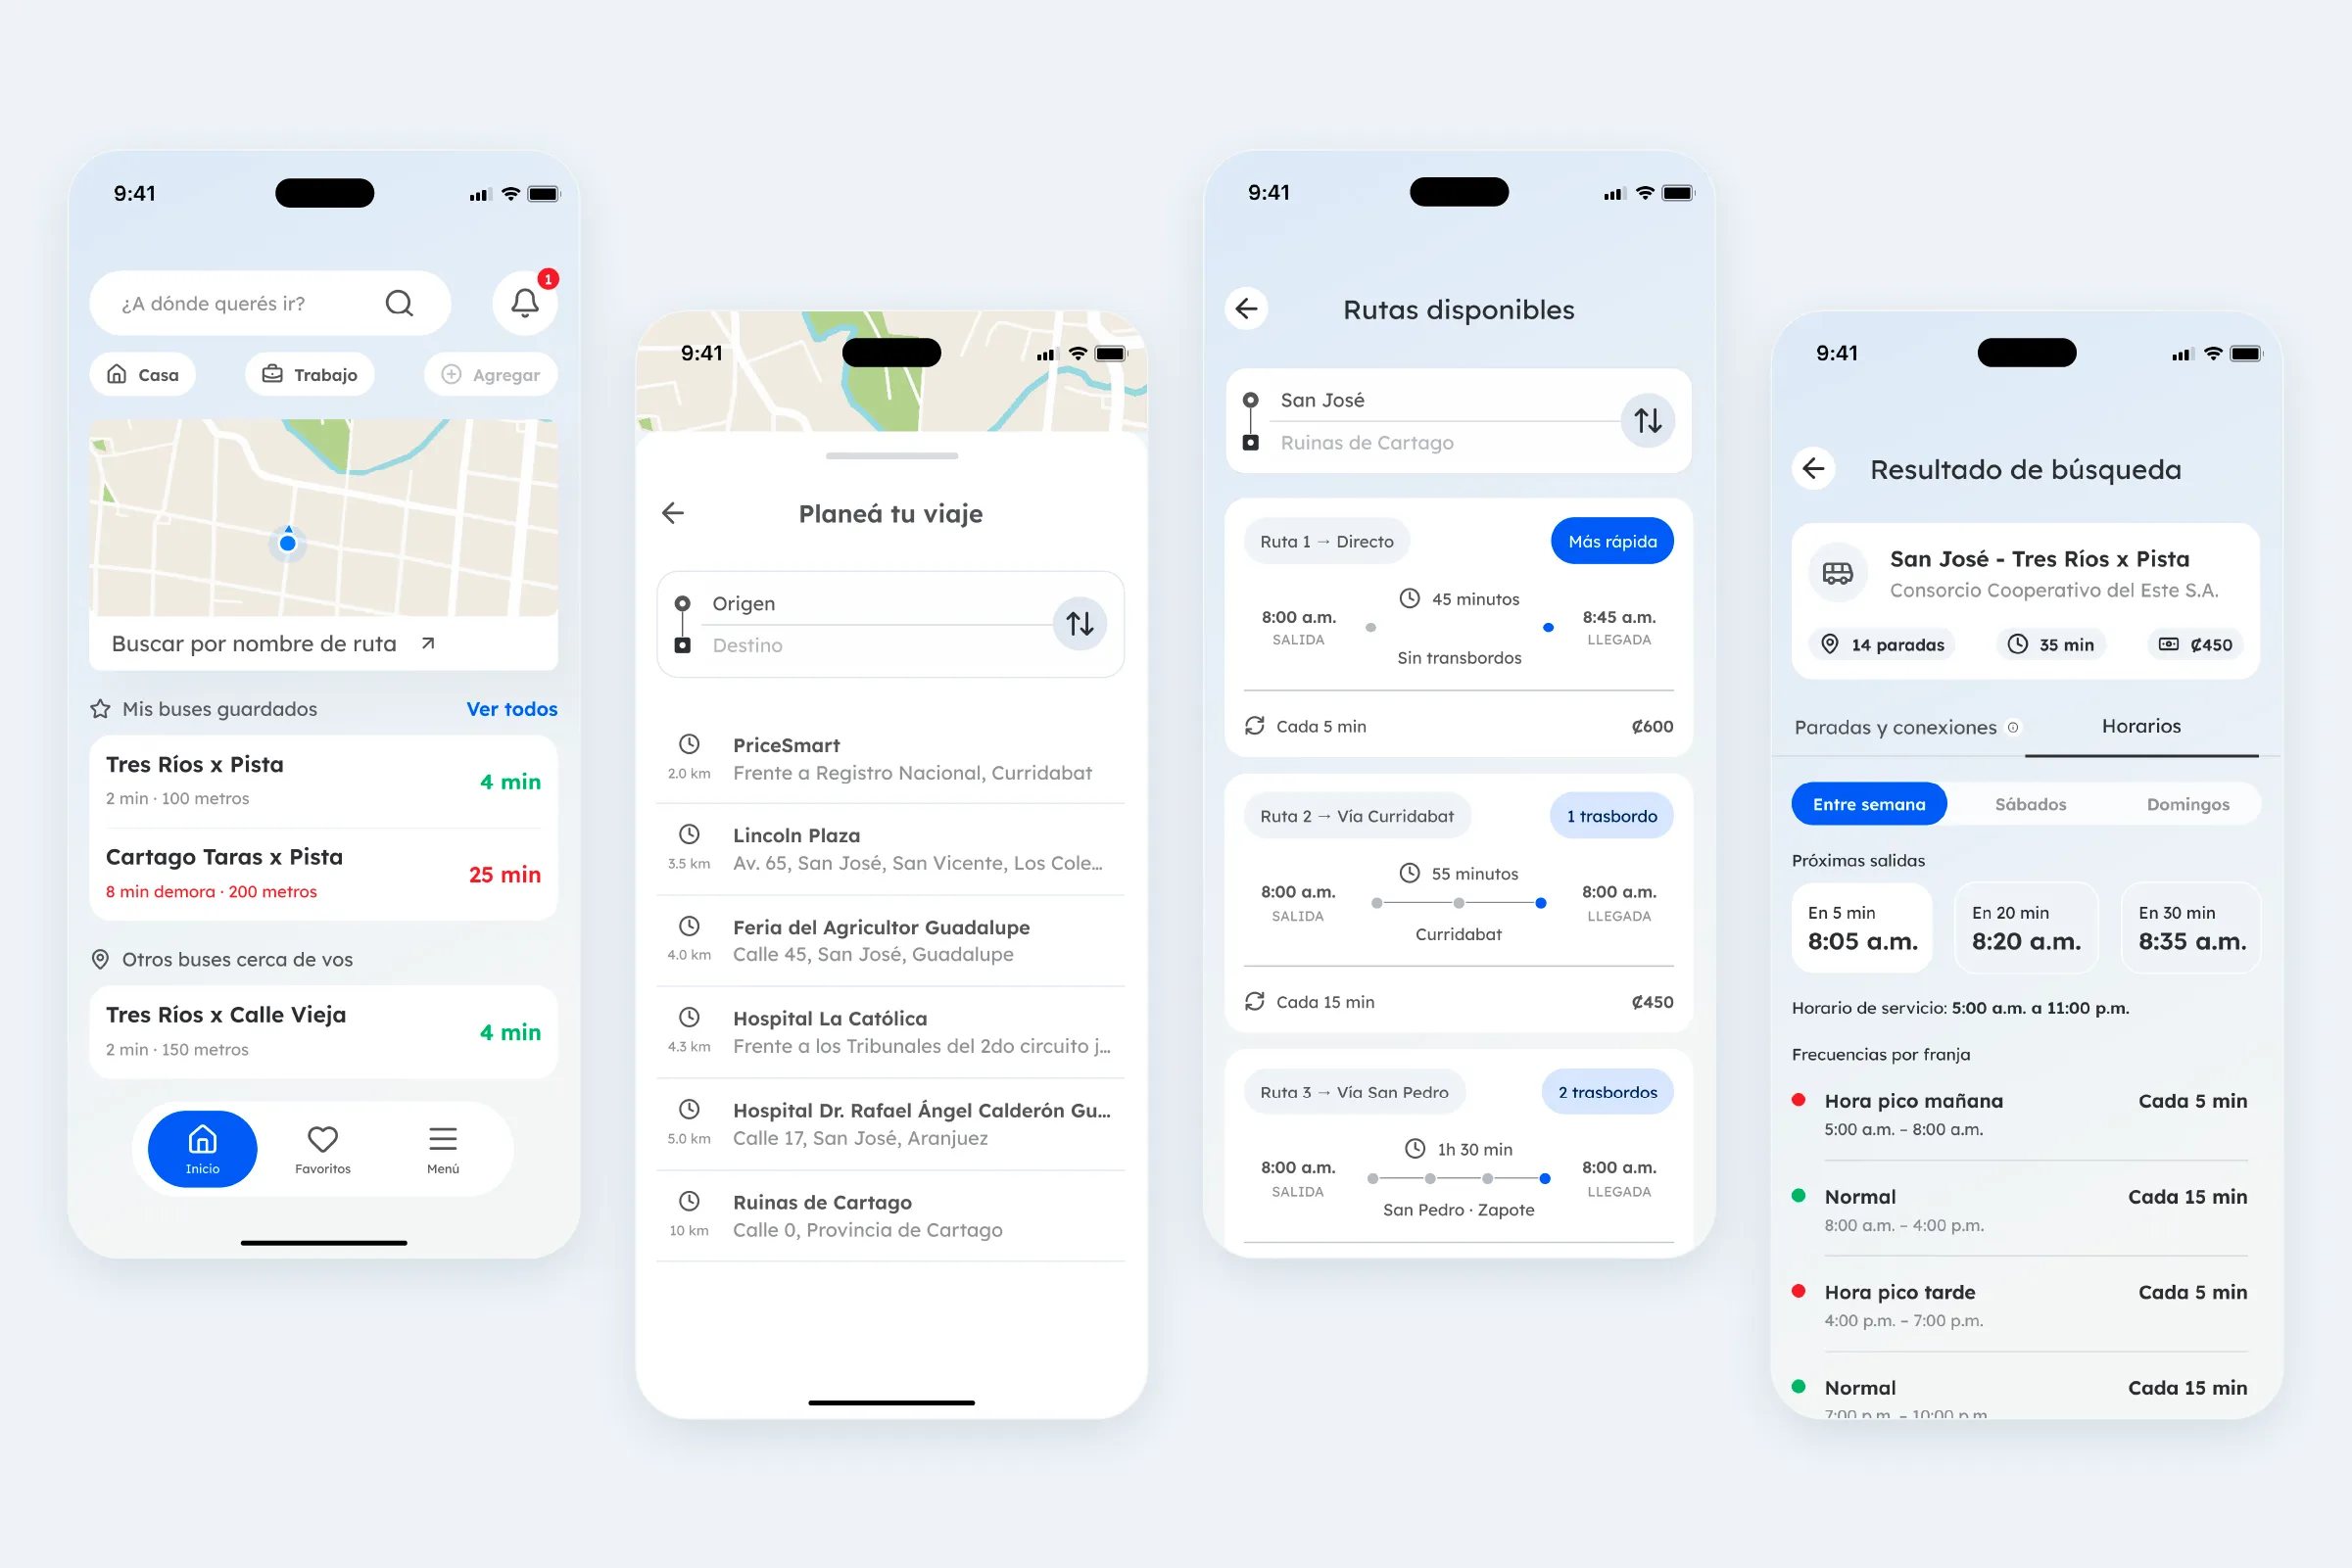
Transita Ecosystem
- Role
- UX Research, Interaction Design, Information Architecture, Naming, UI Design
- Collaboration
- Jose Valverde, Milena Somogyi
- Year
- 2026
End-to-end project, from research to UI design. Public transportation in Costa Rica is fragmented, unreliable, and stressful, especially for people who depend on it to get to work. Poor route connectivity, inconsistent schedules, and limited real-time information force commuters to leave home hours early just to arrive on time.
Research
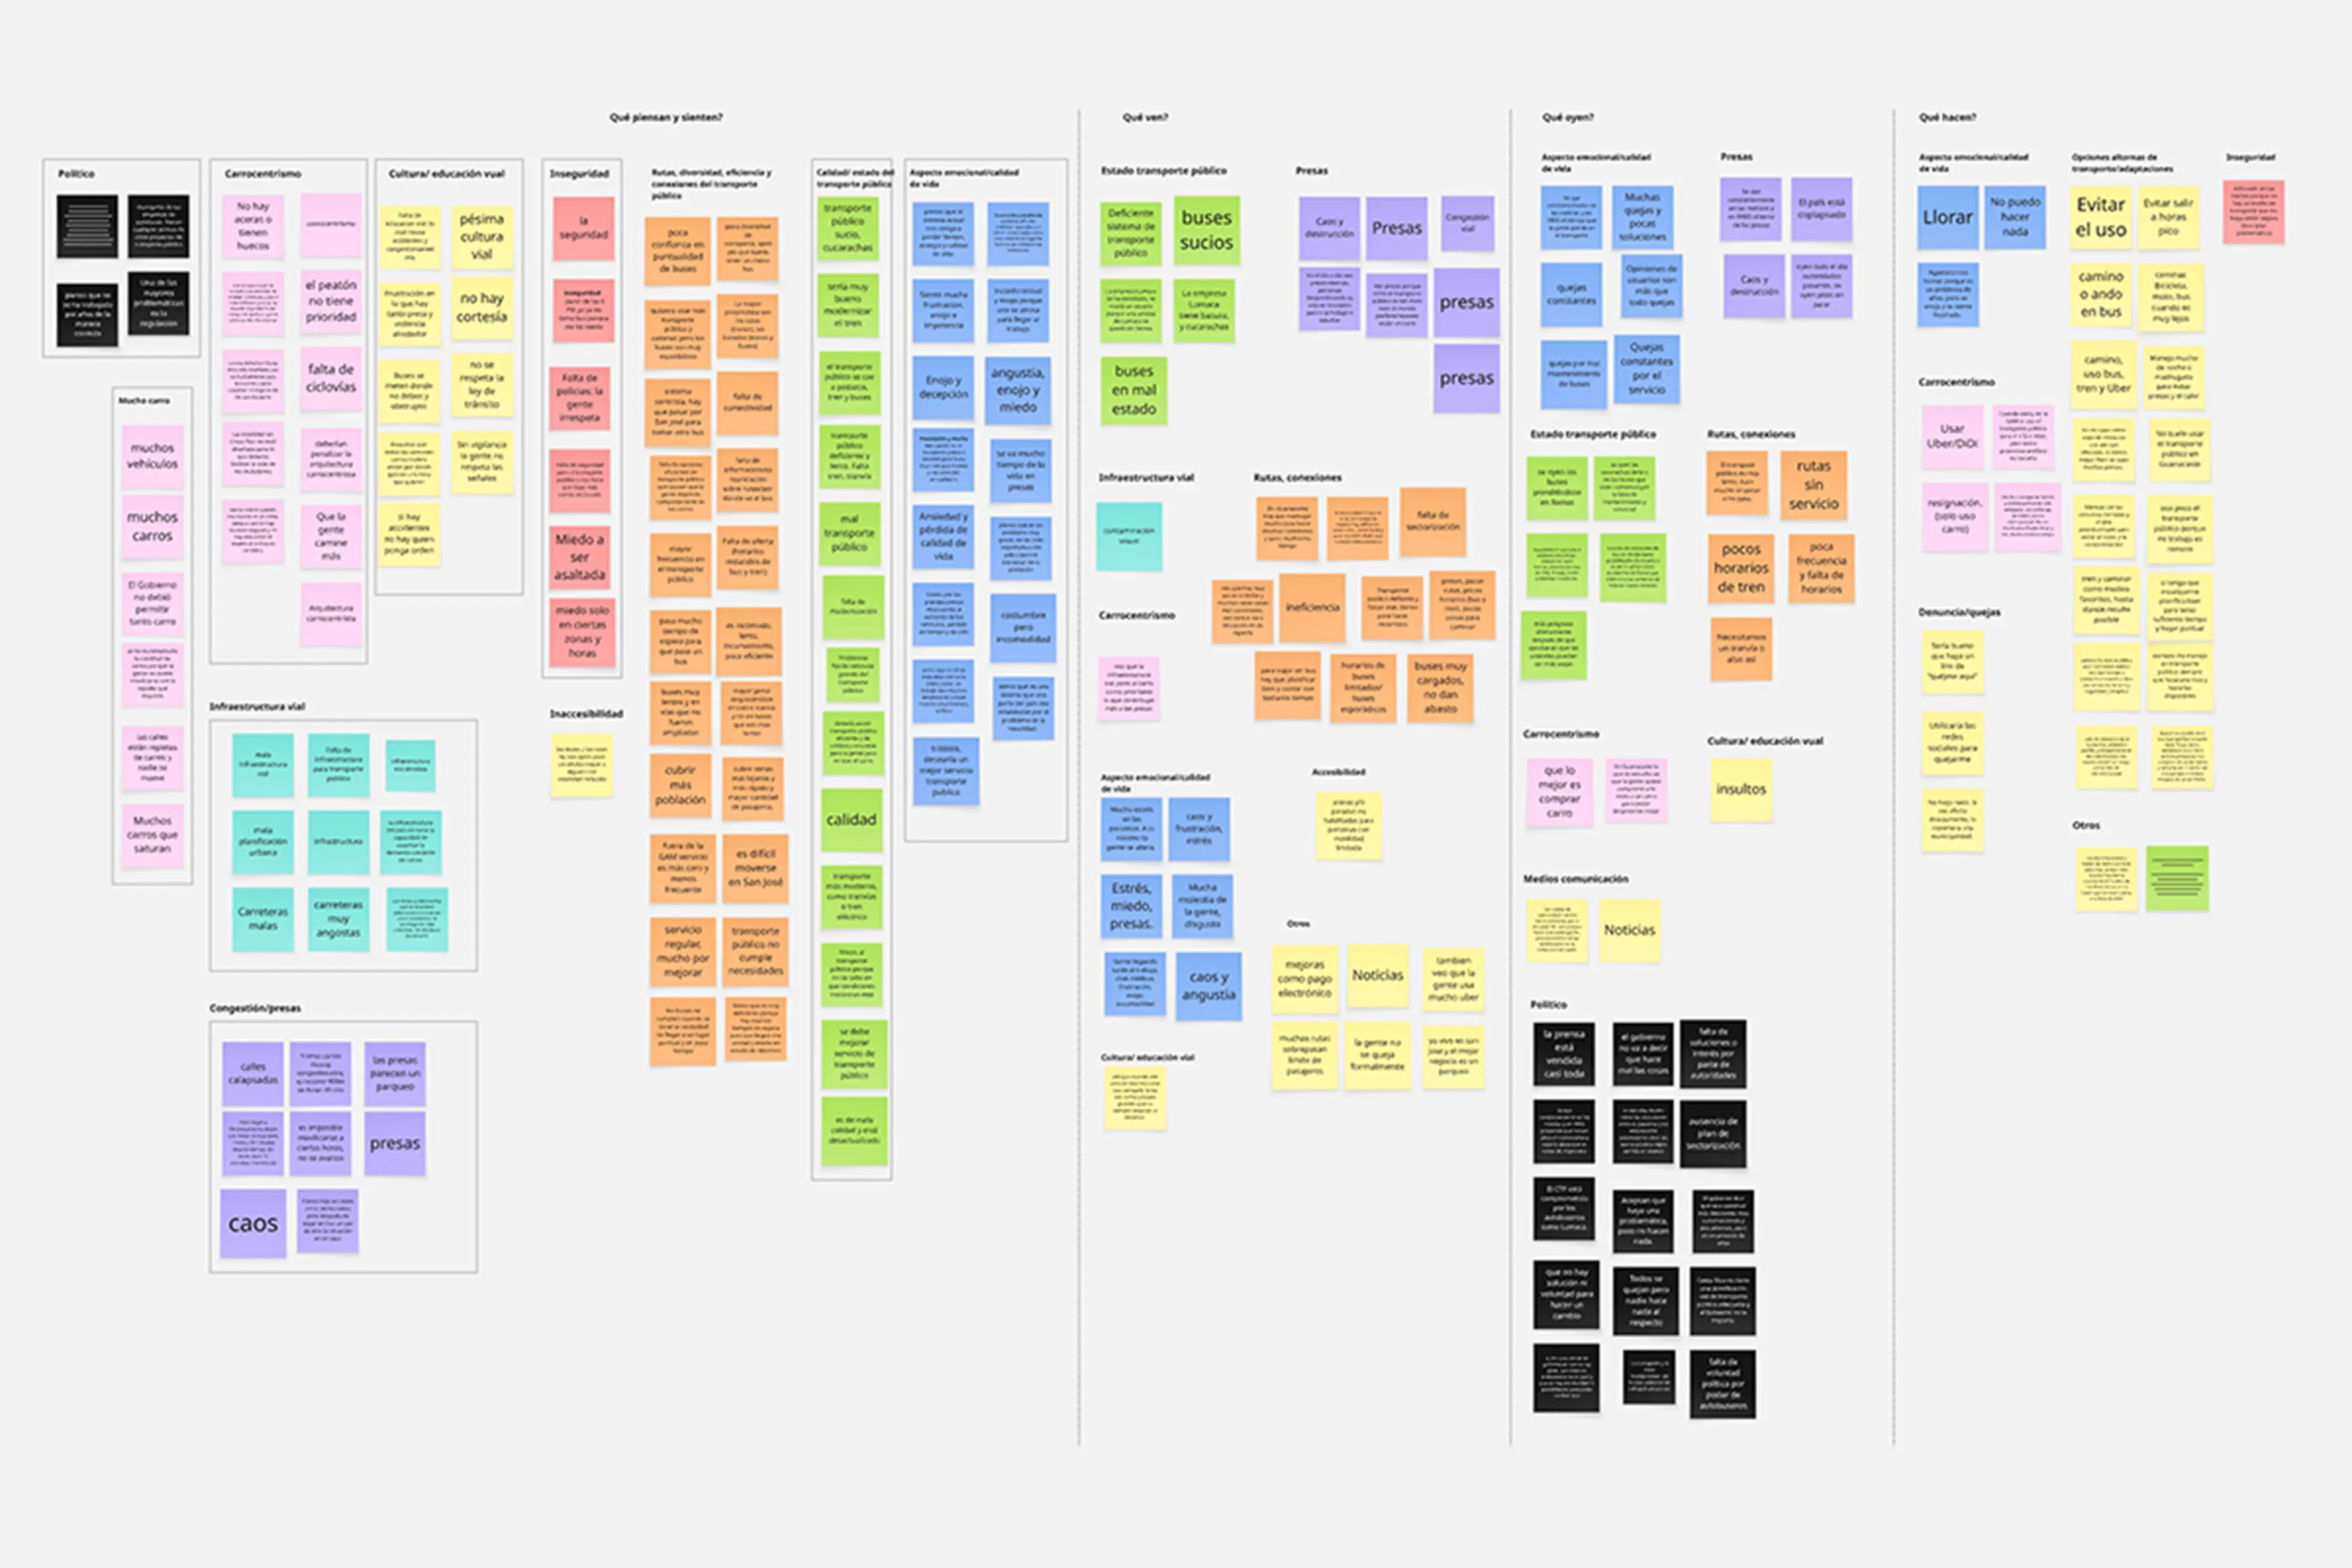
We conducted open-ended interviews with approximately 15 participants across different age groups, locations, and transportation habits. We explored how people experience transportation and mobility in their daily lives, without starting from a predefined problem.
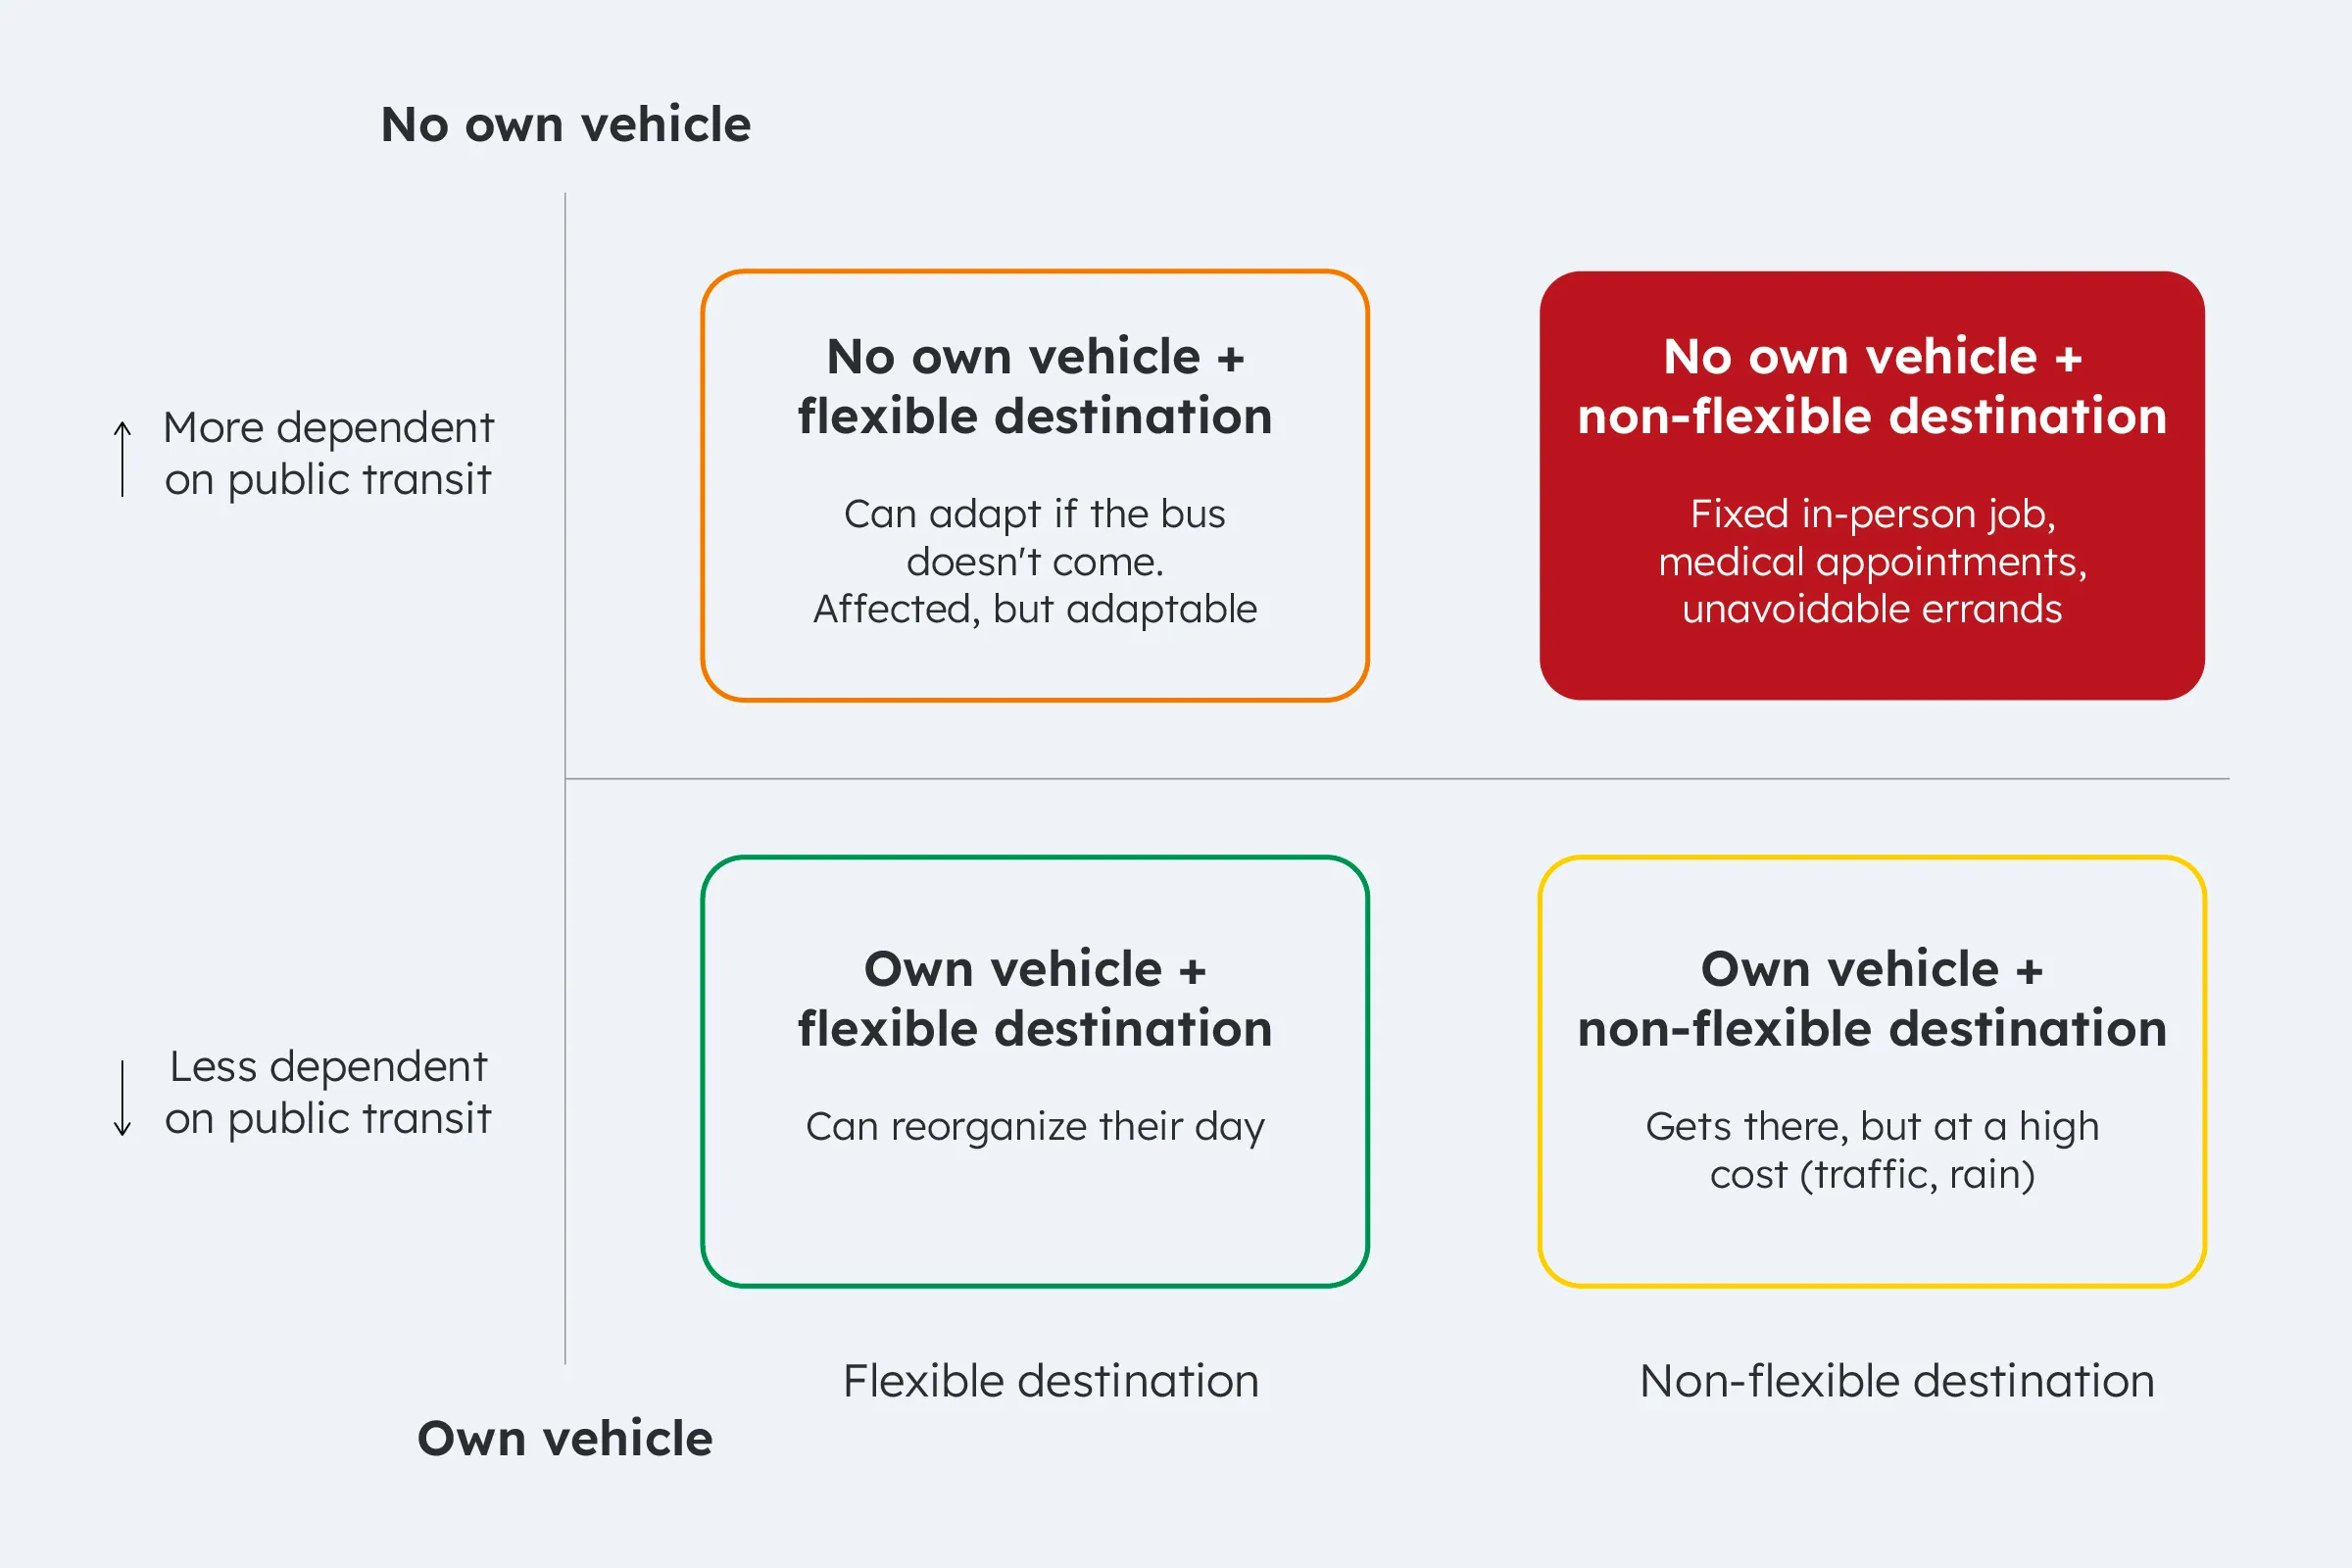
Insight: The most critical users were in-person workers who relied on public transit, had no access to a private vehicle, and commuted to fixed destinations during peak hours.
We then mapped the broader transportation ecosystem, including operators, drivers, government entities, passengers, and physical infrastructure.
Understanding the User
We identified three primary user groups: in-person workers, university students with fixed schedules, and older adults, creating four personas based on interview data.
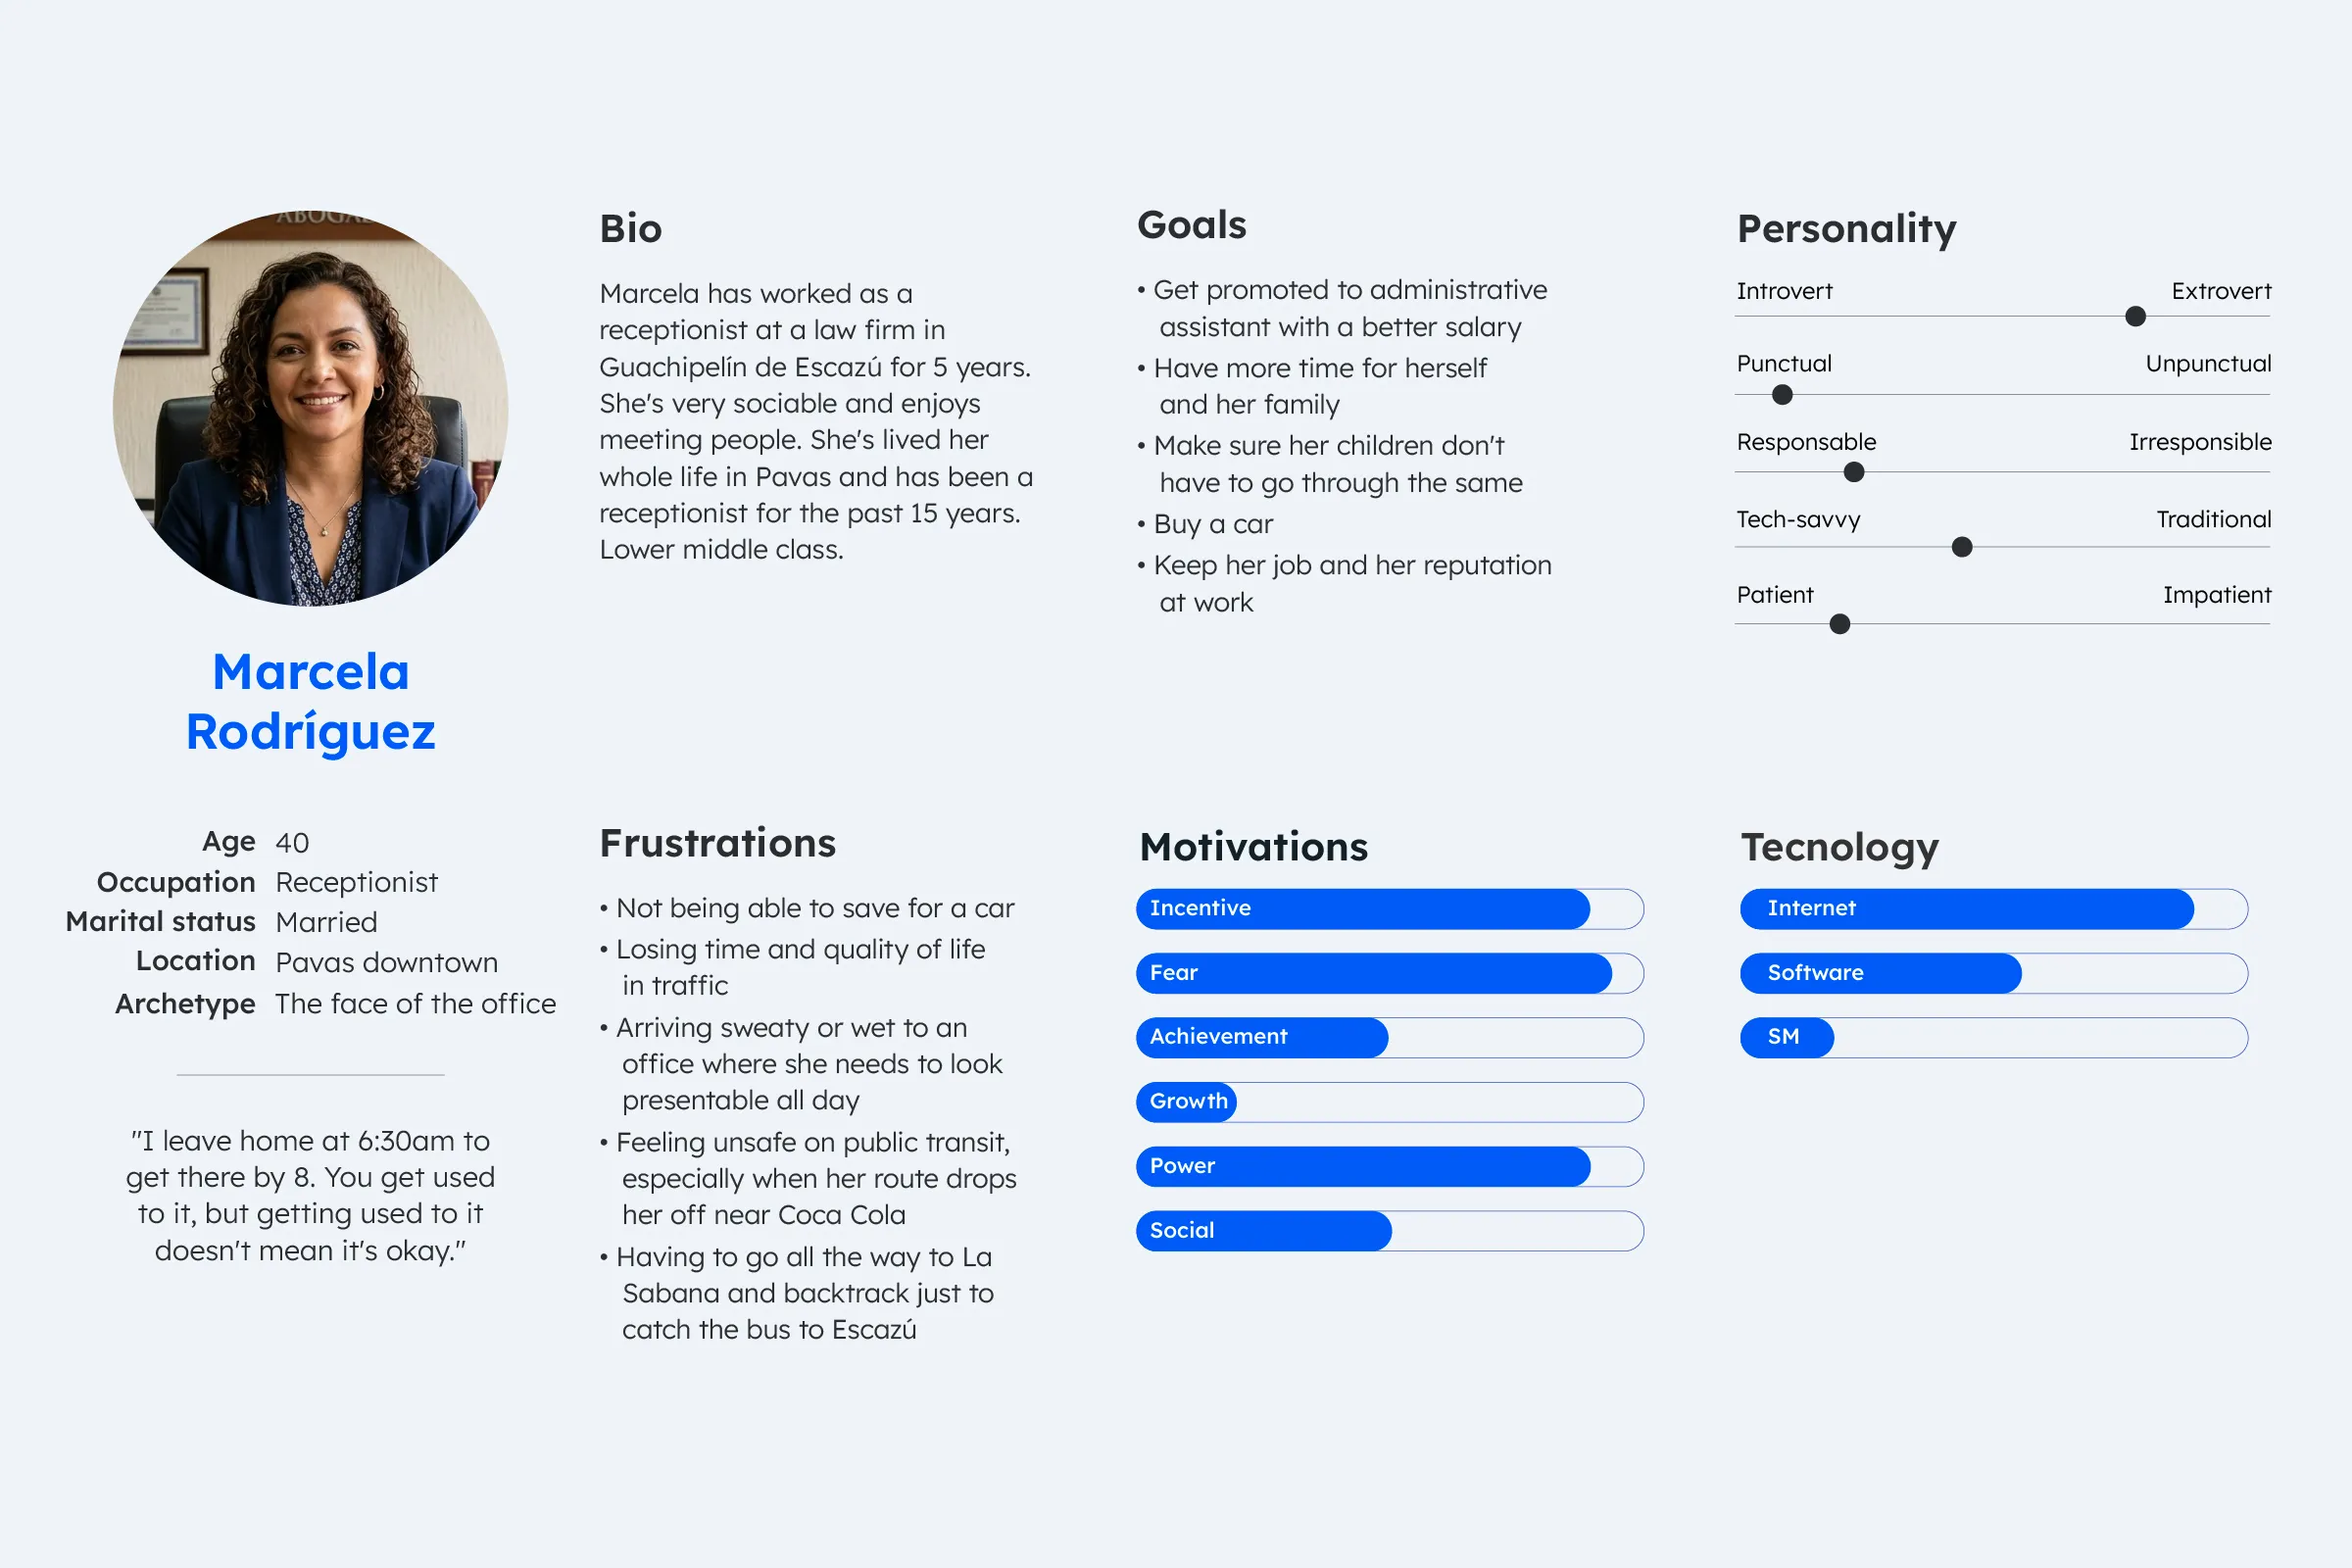
Women faced additional challenges around safety, access to private transportation, and caregiving trips. This informed our primary persona, Marcela, a receptionist commuting from Pavas to Escazú, who became the focus of our journey map.
Journey & Opportunities
We mapped both directions of Marcela’s commute to capture how her experience changed throughout the day. While unpredictable wait times, exhausting transfers, and limited information affected her overall journey, the return commute added further strain as afternoon rain increased traffic, overcrowding, and delays.
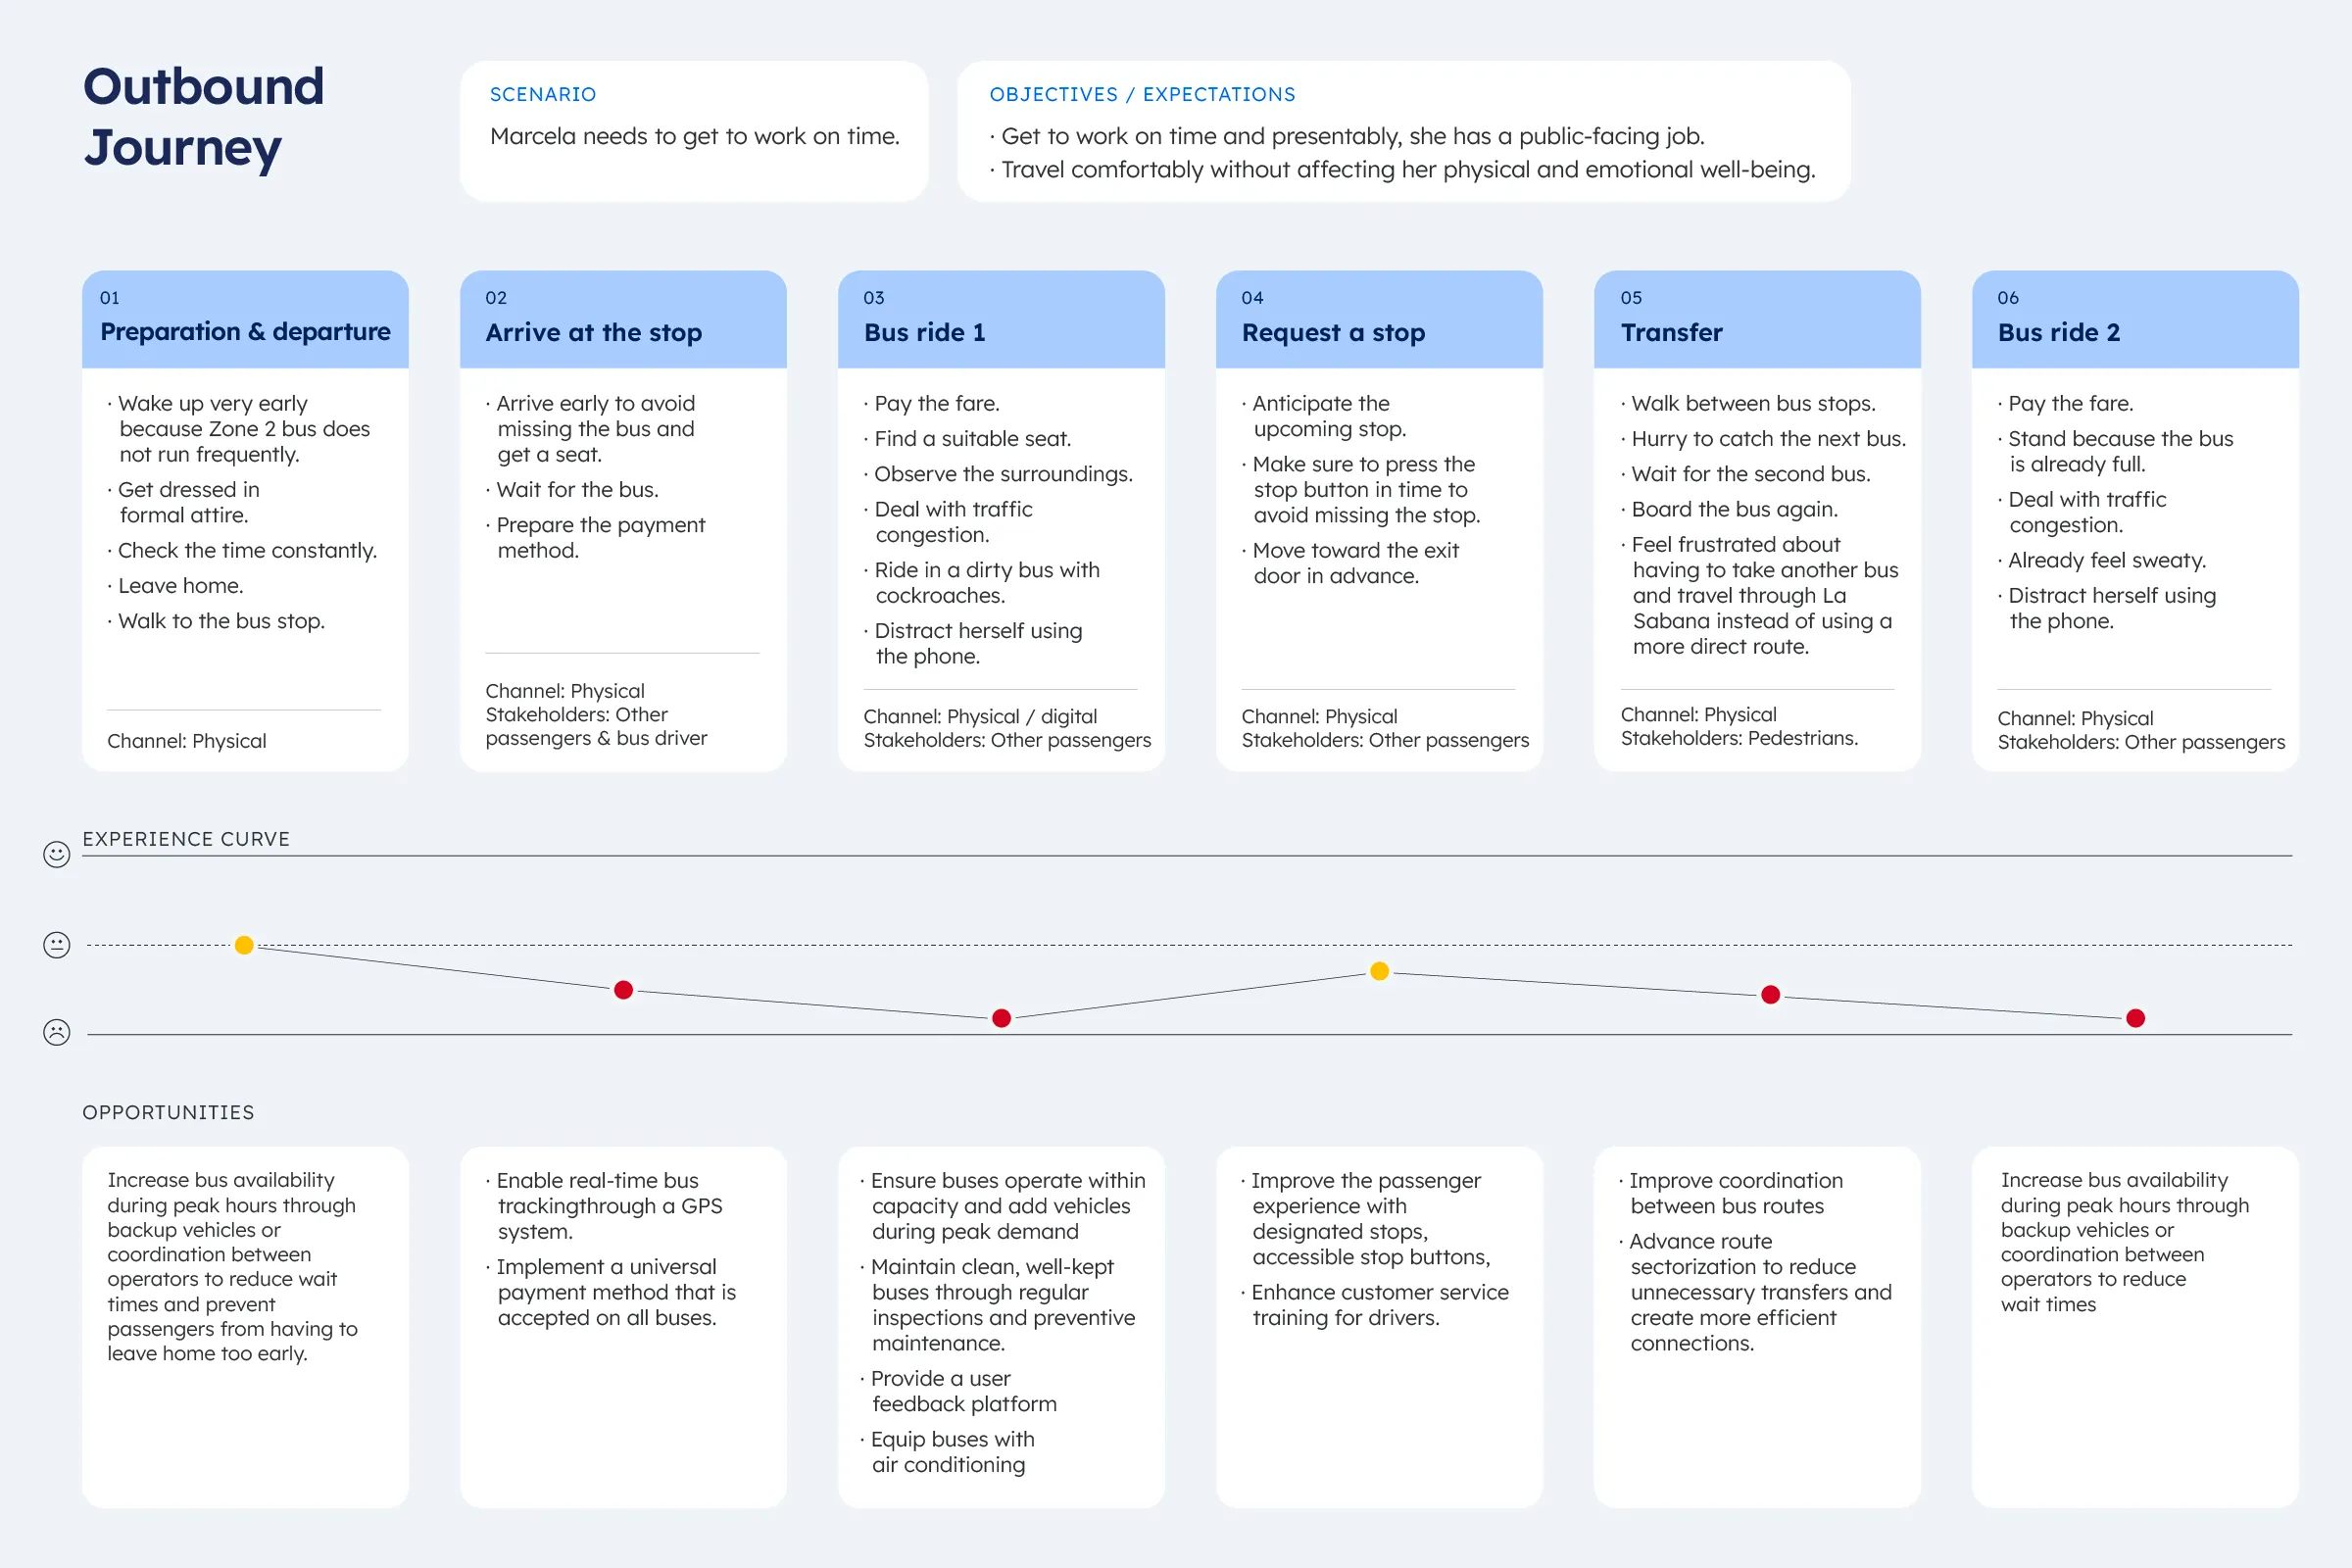
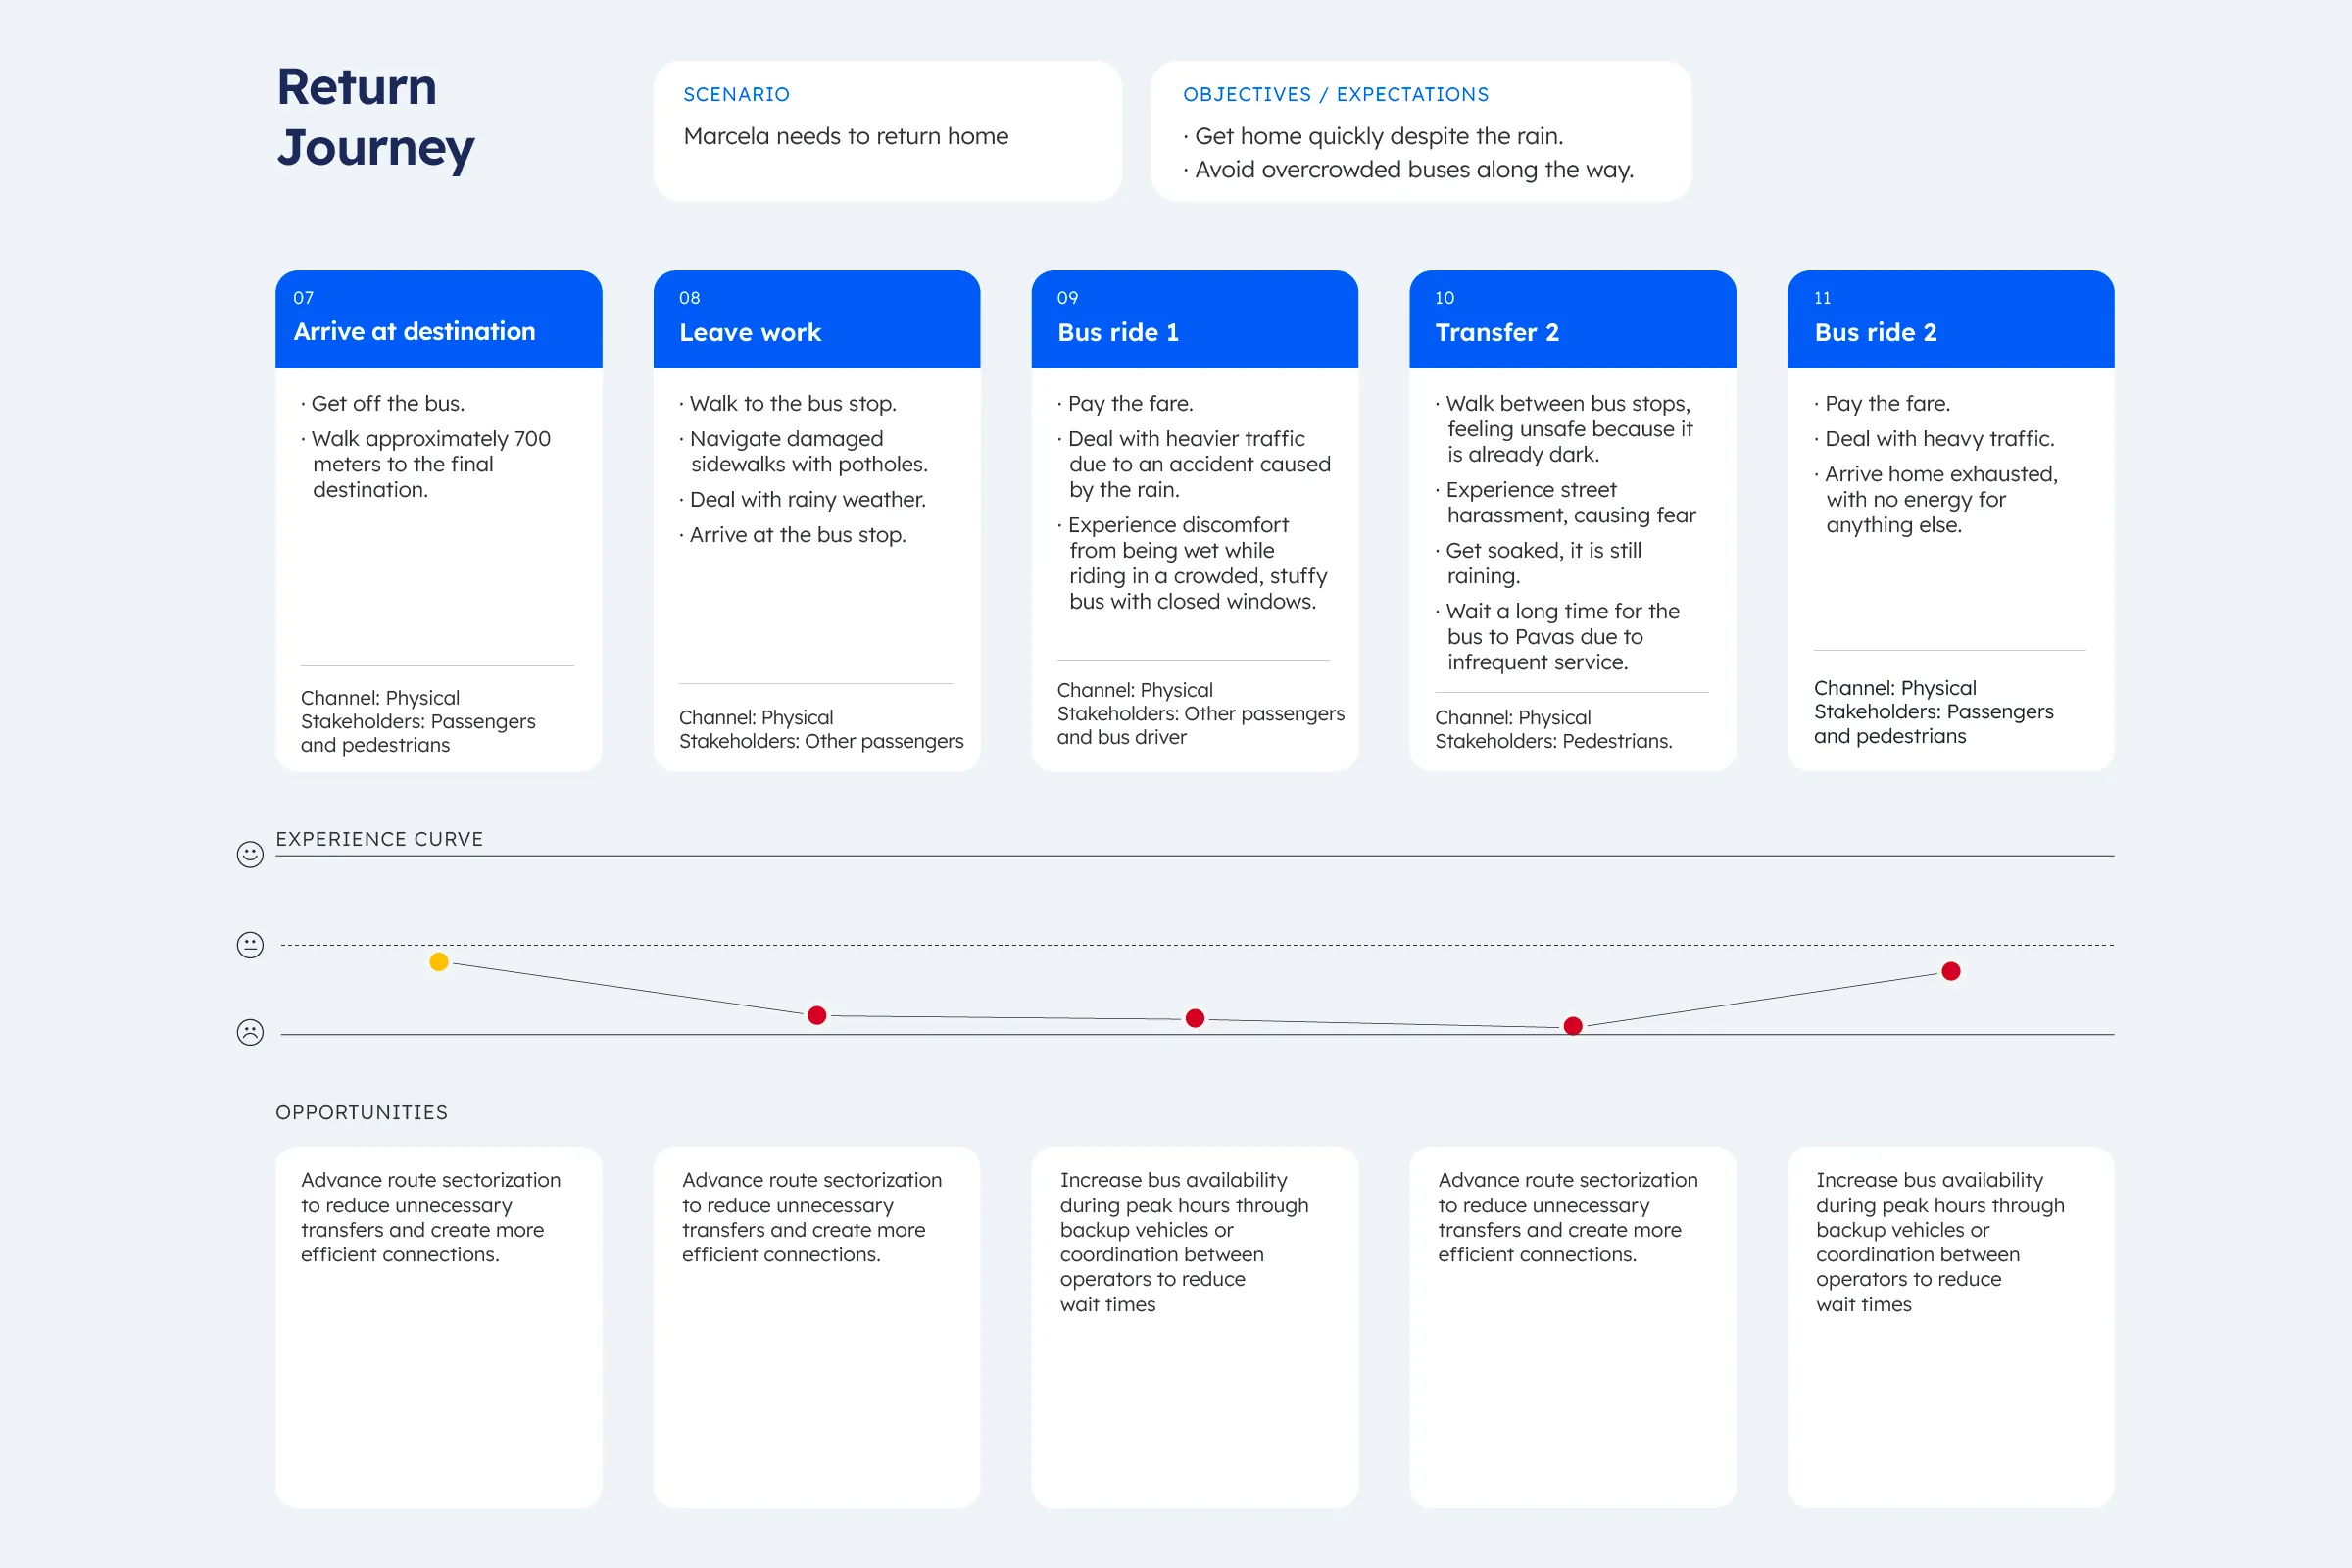
We prioritized opportunities based on their potential to reduce travel time and improve commuters’ physical and emotional well-being. The two most impactful opportunities that emerged were: real-time bus tracking via GPS and increased service frequency.
Validation
We conducted seven in-depth interviews with in-person workers, followed by a survey of 61 participants to validate and quantify the patterns we observed.
Key insight: Public transit users experience a loss of control over their time. Unpredictable schedules, unreliable information, overcrowding, and lengthy transfers force commuters to plan hours in advance, sacrificing time, comfort, and peace of mind just to arrive on time.
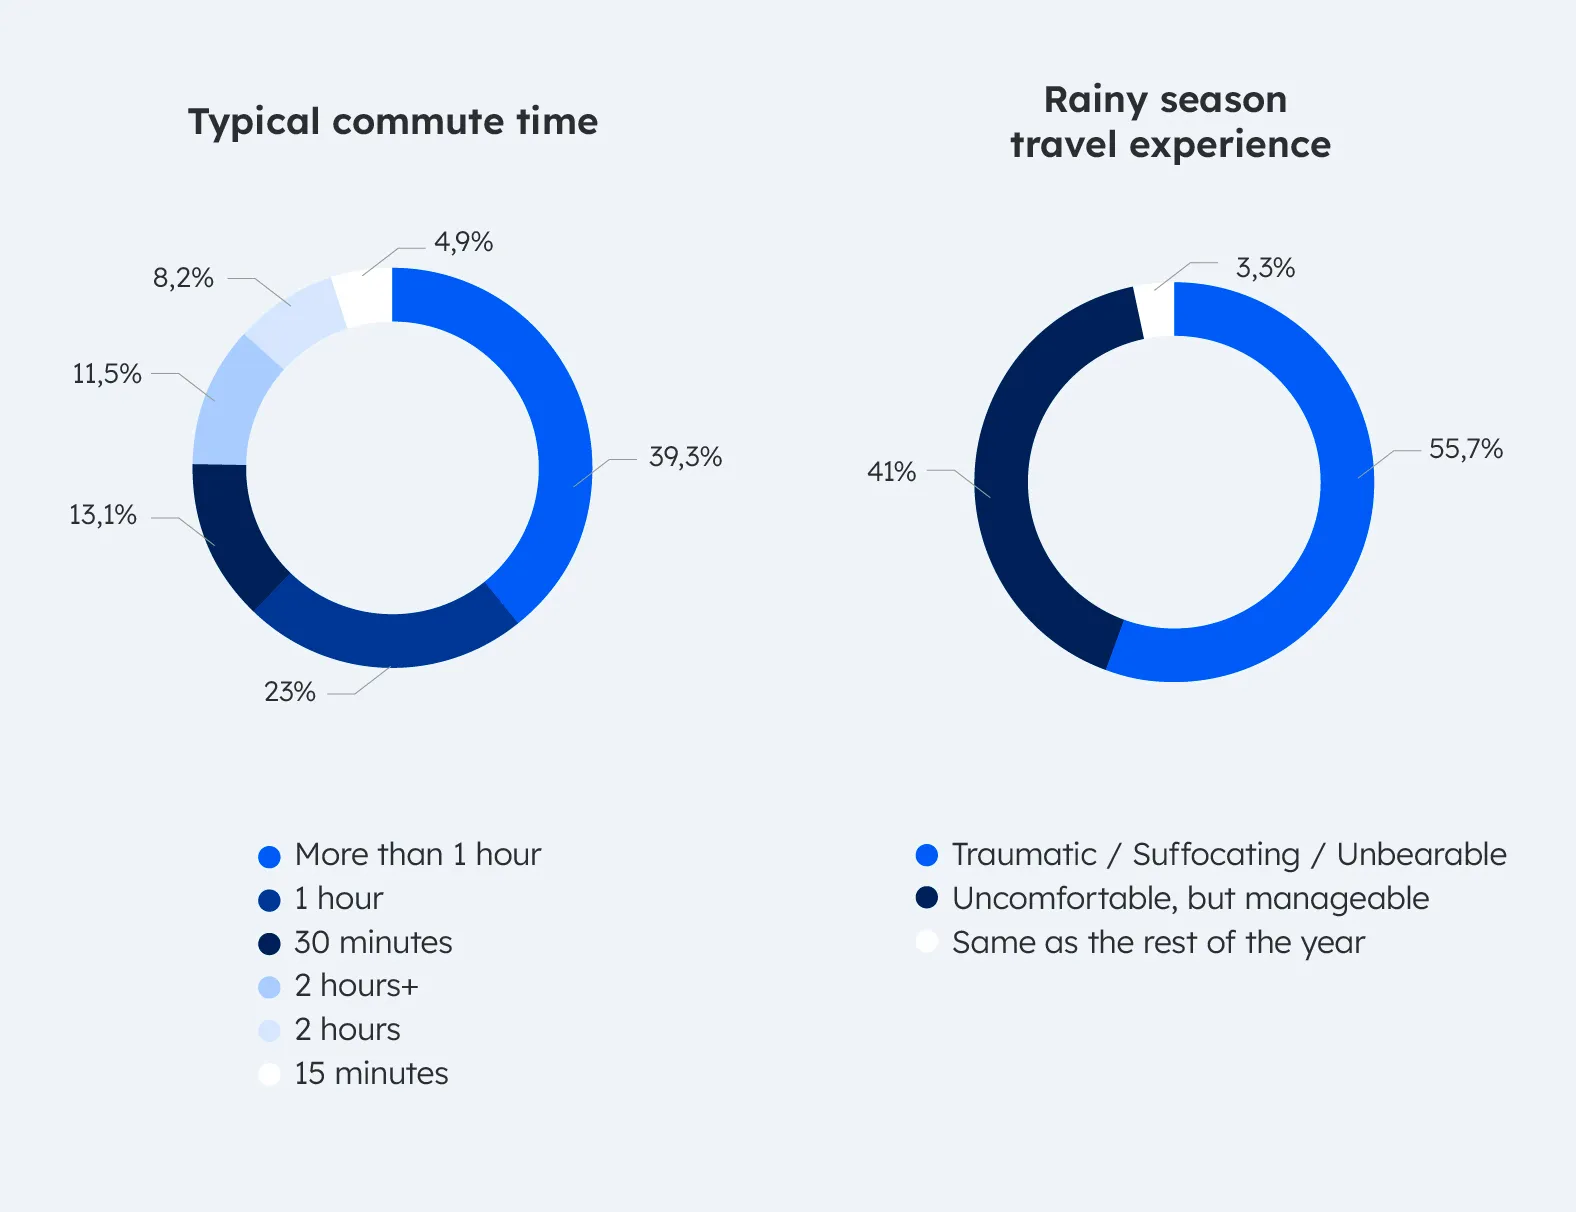
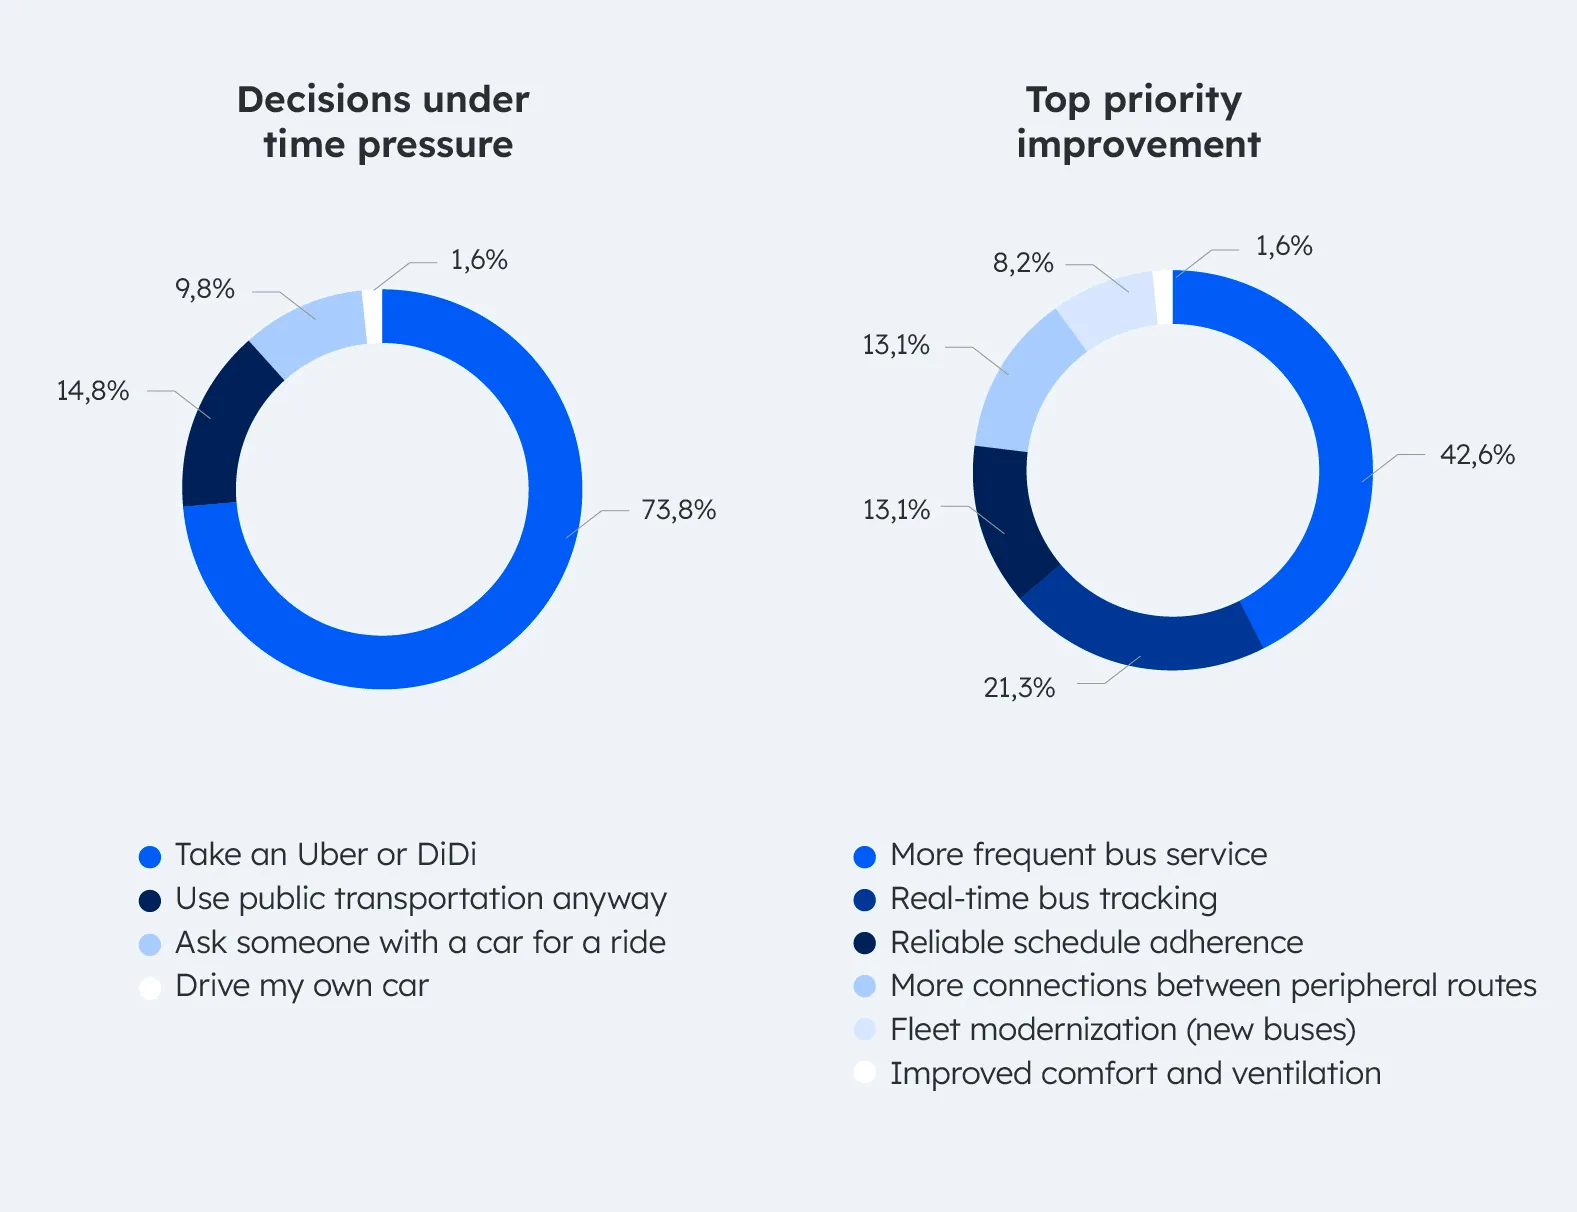
The survey confirmed the scale of these challenges:
- 82% commute at least one hour each way.
- 72% wake up 2–3 hours earlier due to unreliable schedules.
- 74% face unexpected costs when buses fail to arrive.
- 49% experience chronic stress and anxiety linked to transit uncertainty.
The Transita Ecosystem
The final proposal was an integrated transit platform combining increased bus frequency, route synchronization, and real-time communication. Improving reliability required coordination across the entire transit network, not just better information for riders.
The solution evolved into Transita, an ecosystem composed of three interconnected products.
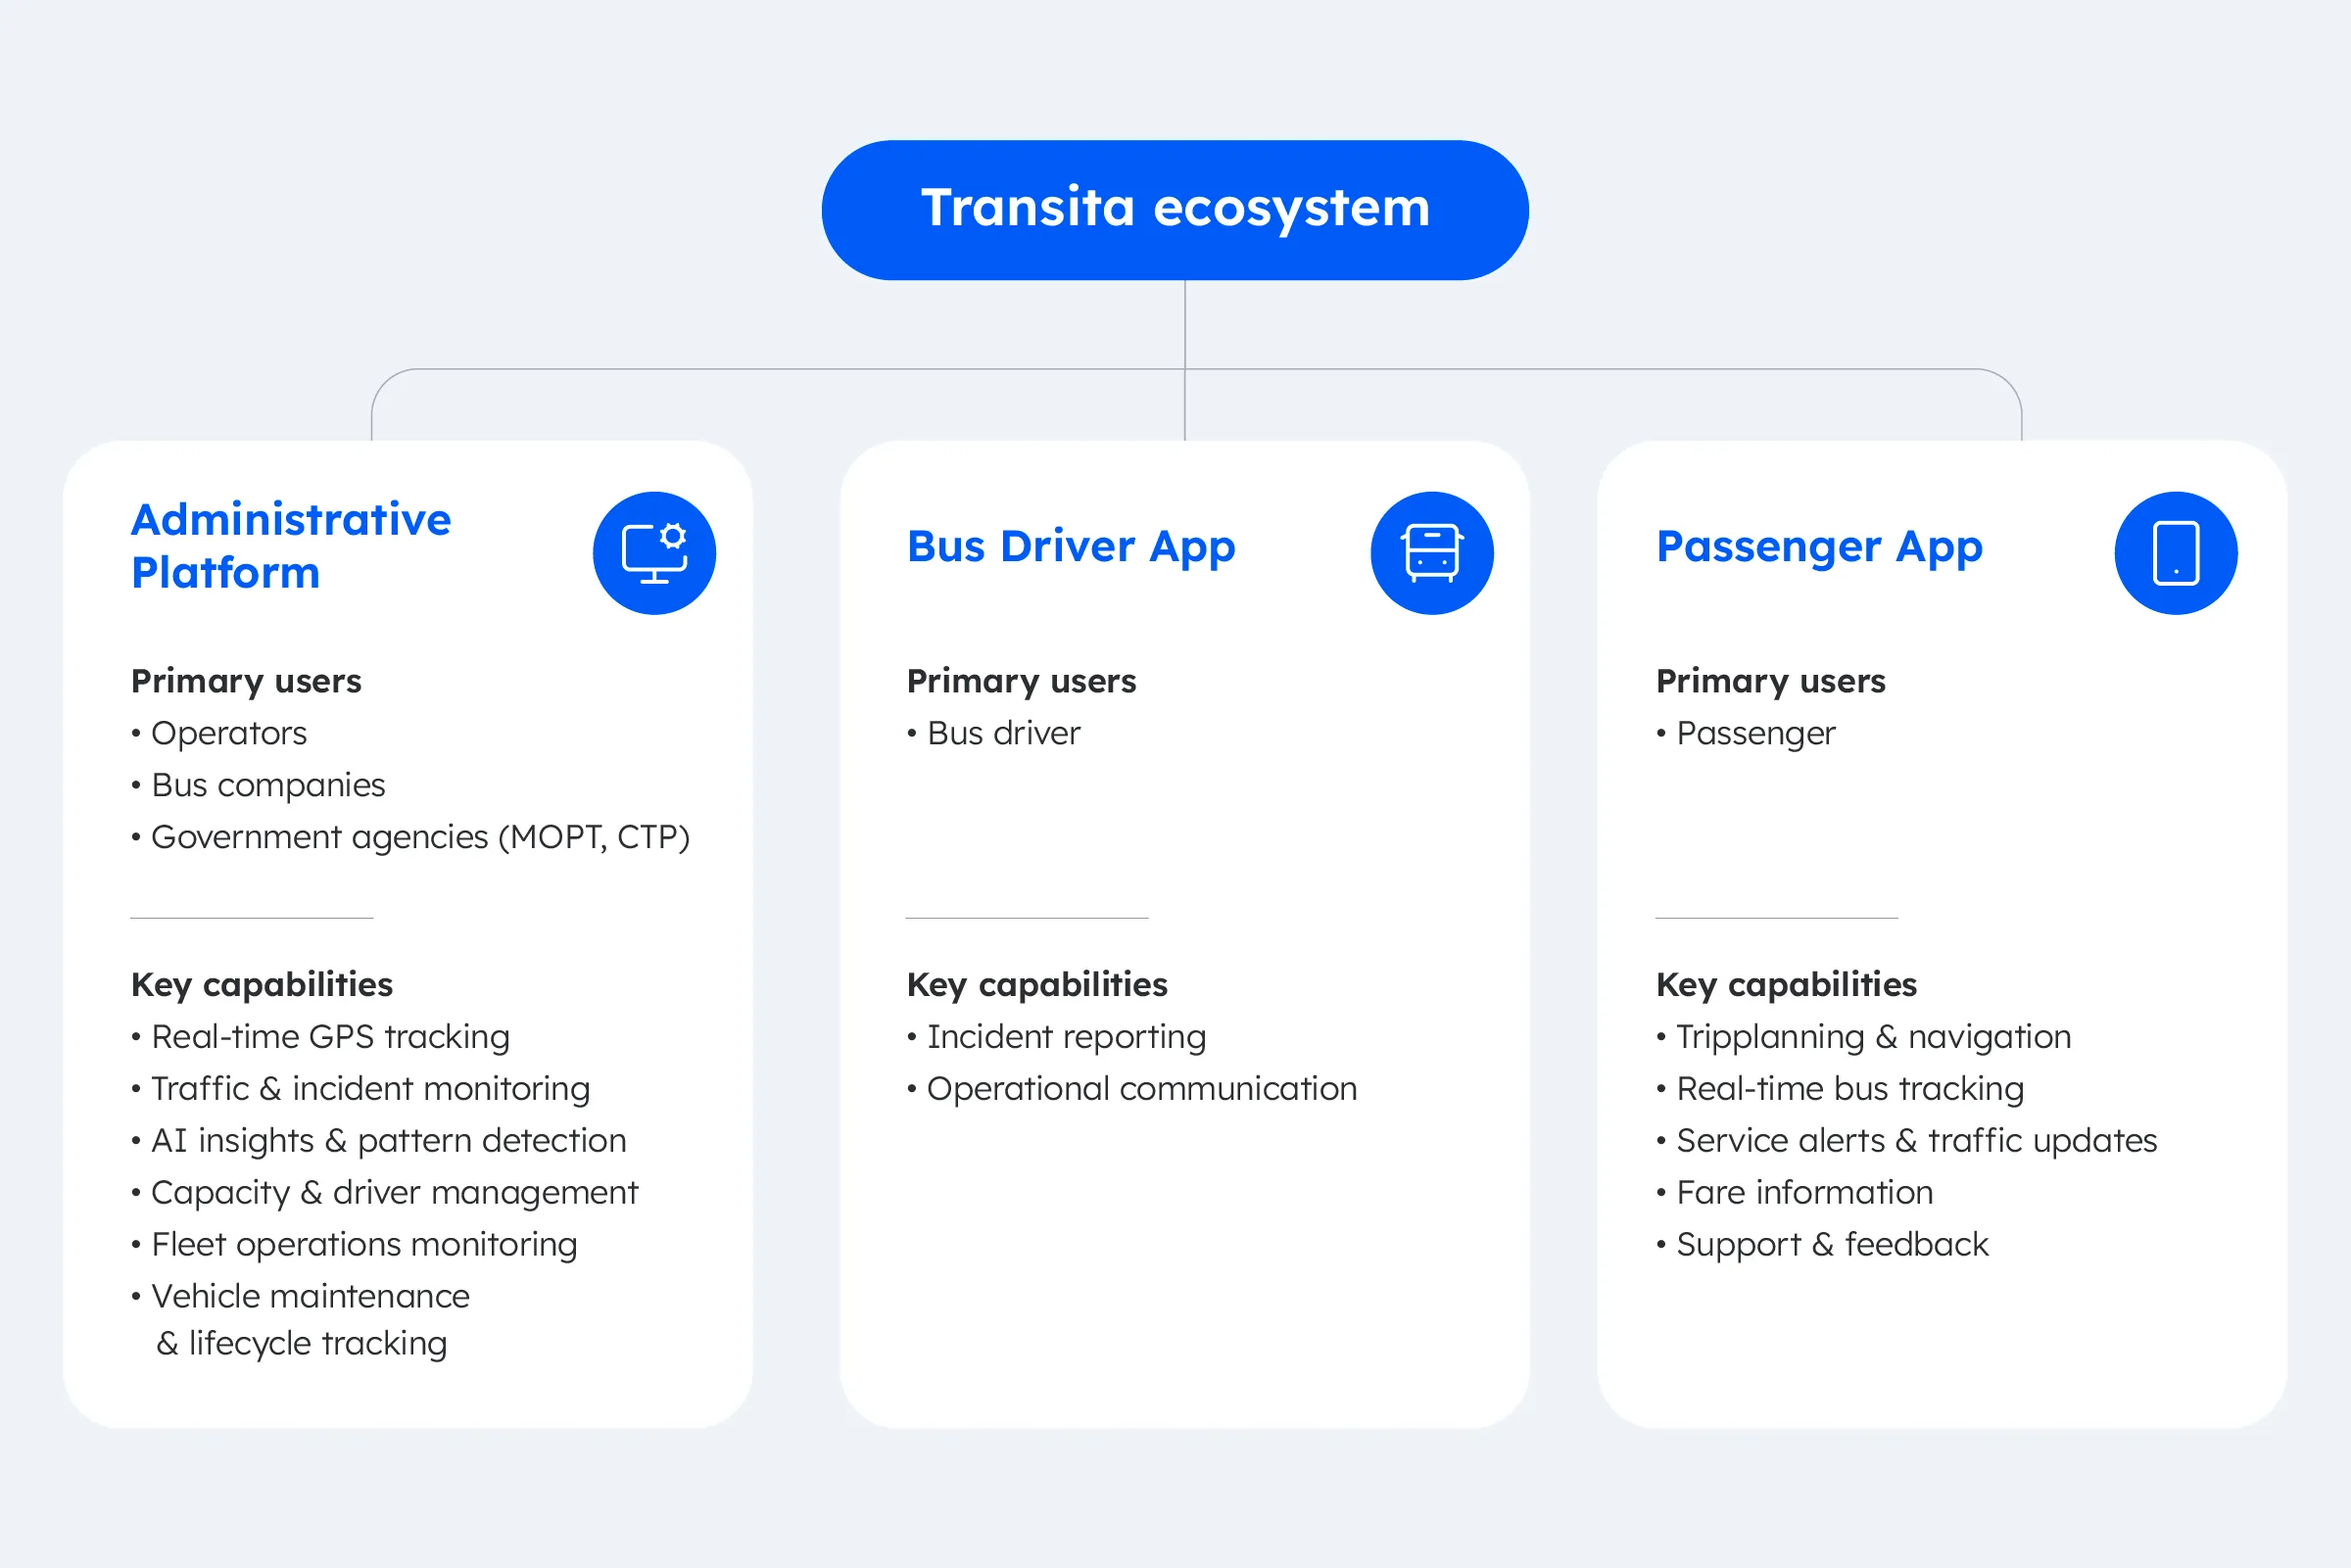
From Research to Design
We focused on the Passenger App, where uncertainty had the greatest impact on the commuting experience. Our initial wireframes explored route planning, stop information, real-time tracking, and incident alerts.
Testing
We conducted an initial usability test with four participants, covering key journeys such as onboarding, route planning, transfers, favorites, schedules, and incident reporting.

Testing revealed opportunities to improve clarity and navigation, leading us to refine the information architecture, redesign key screens, and optimize incident reporting.
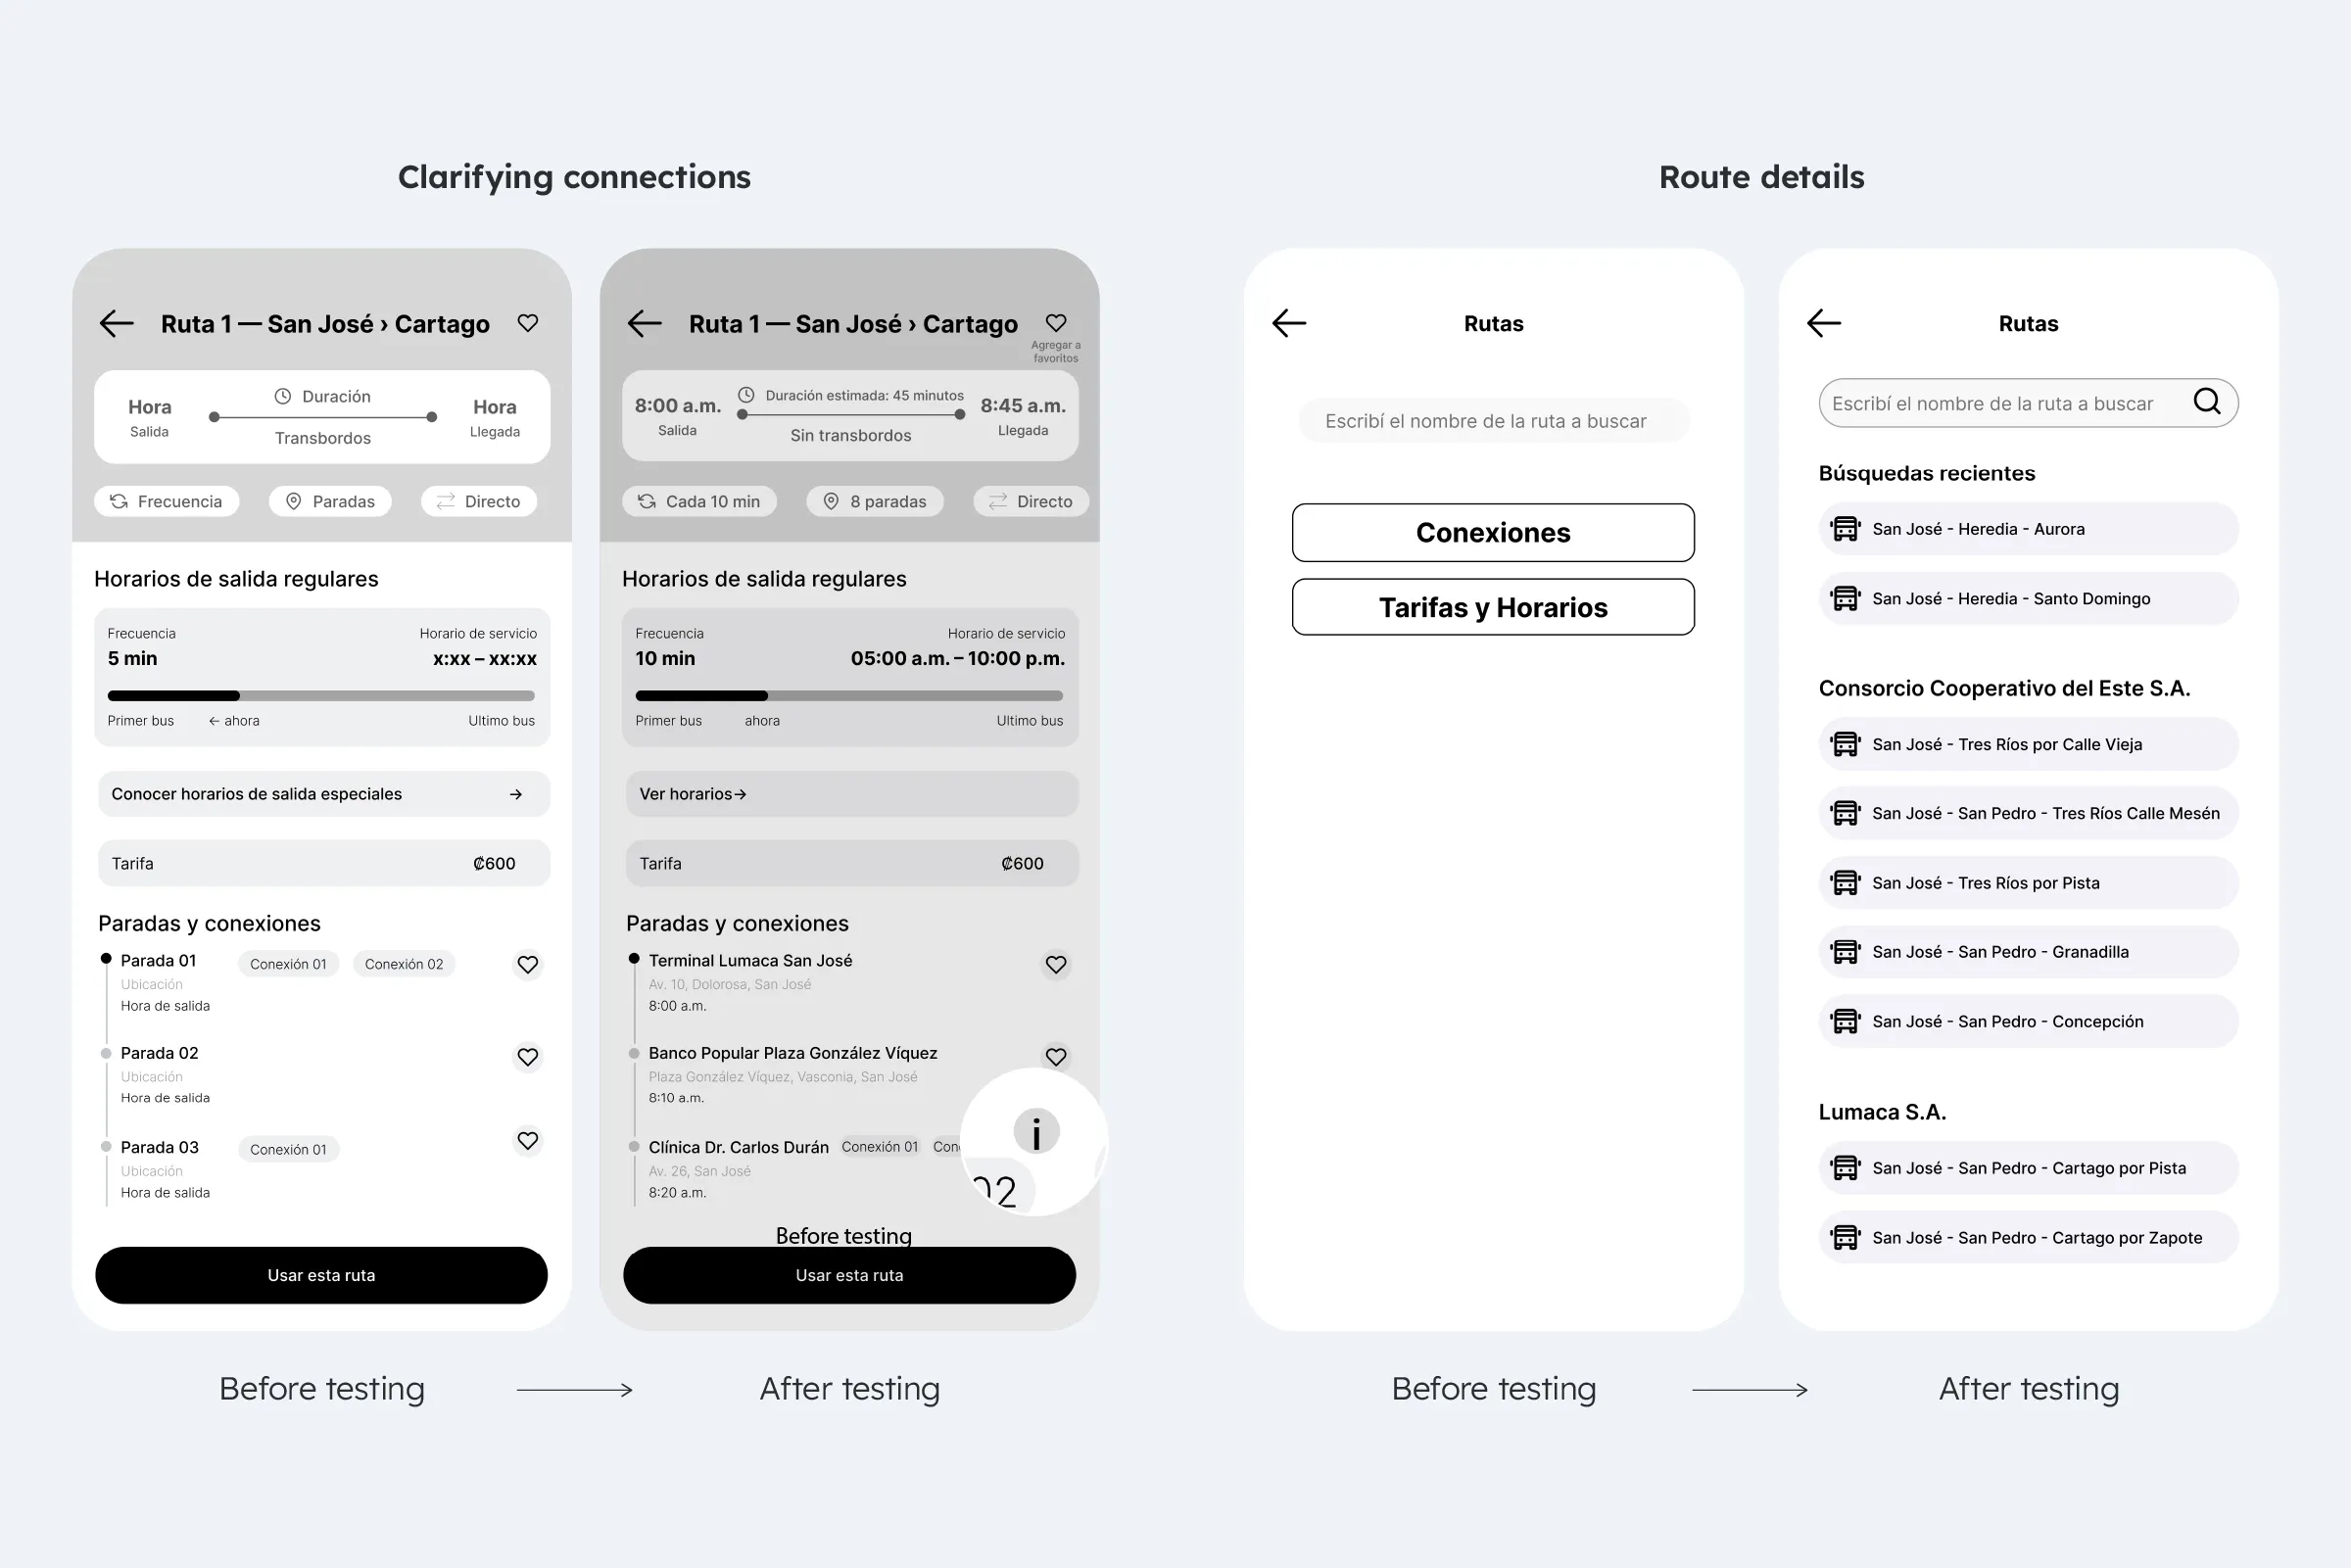
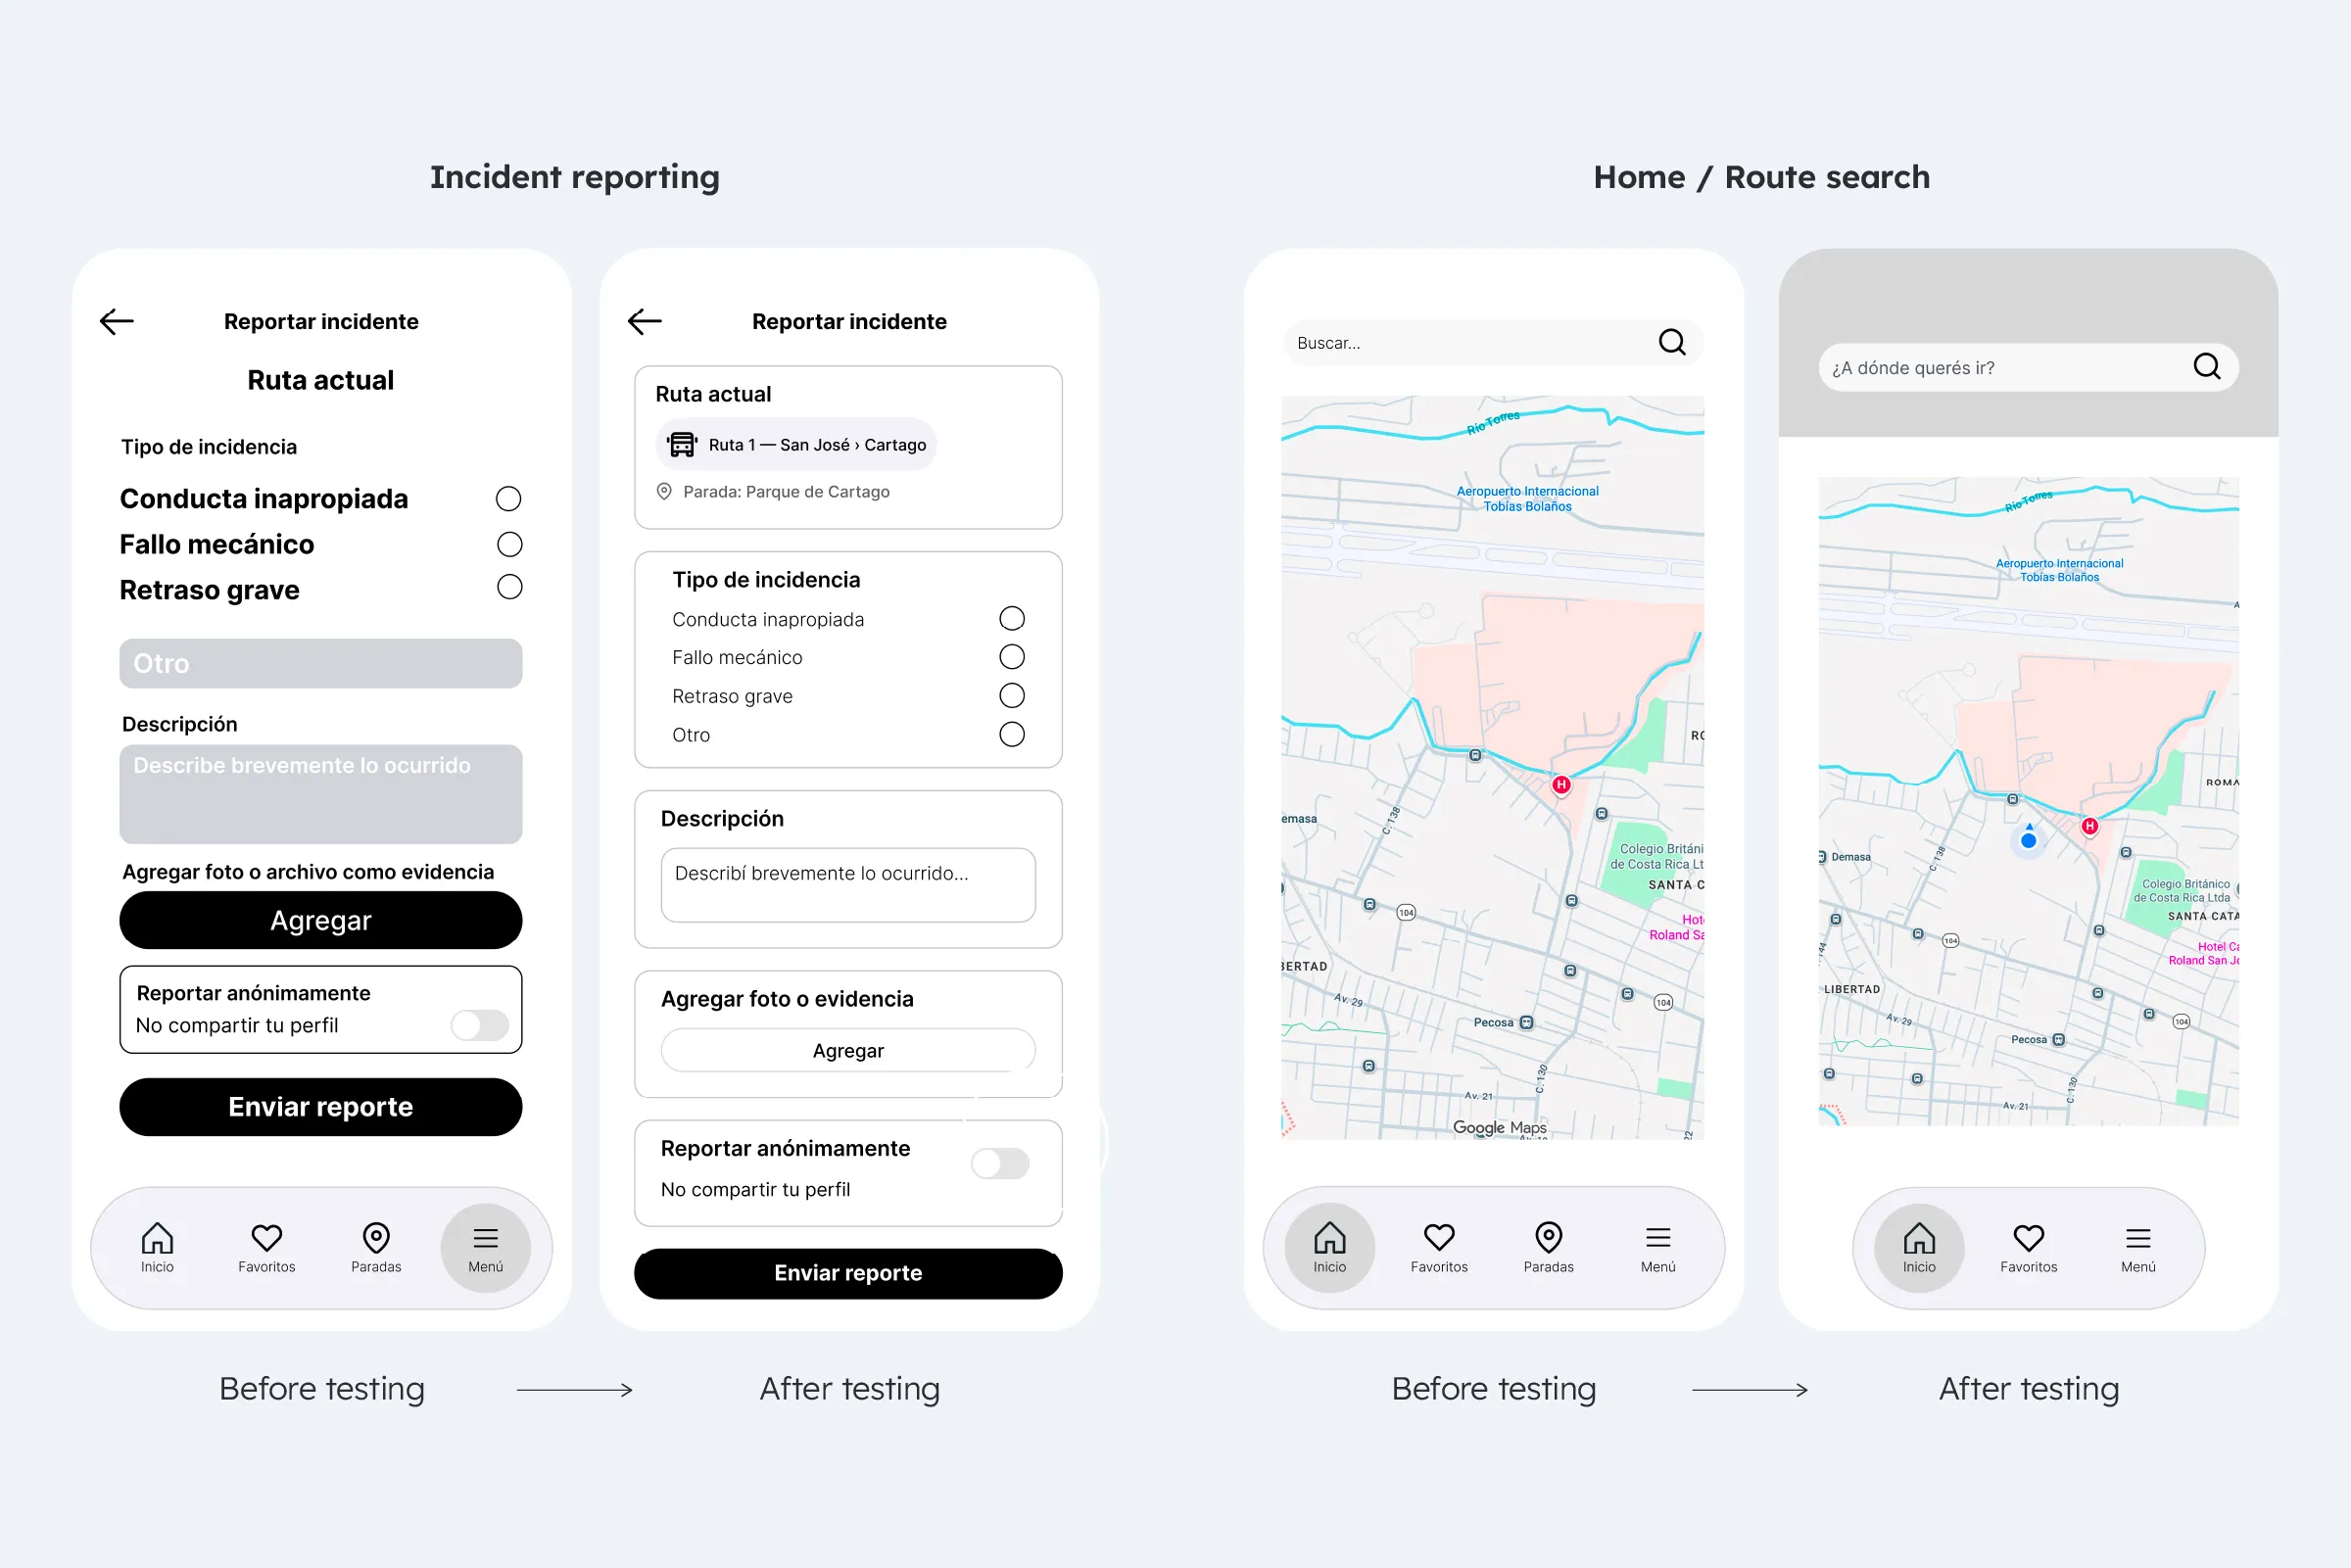
Even with limited functionality in the initial prototype, users saw strong potential in Transita to reduce uncertainty when using public transportation.
Final UI
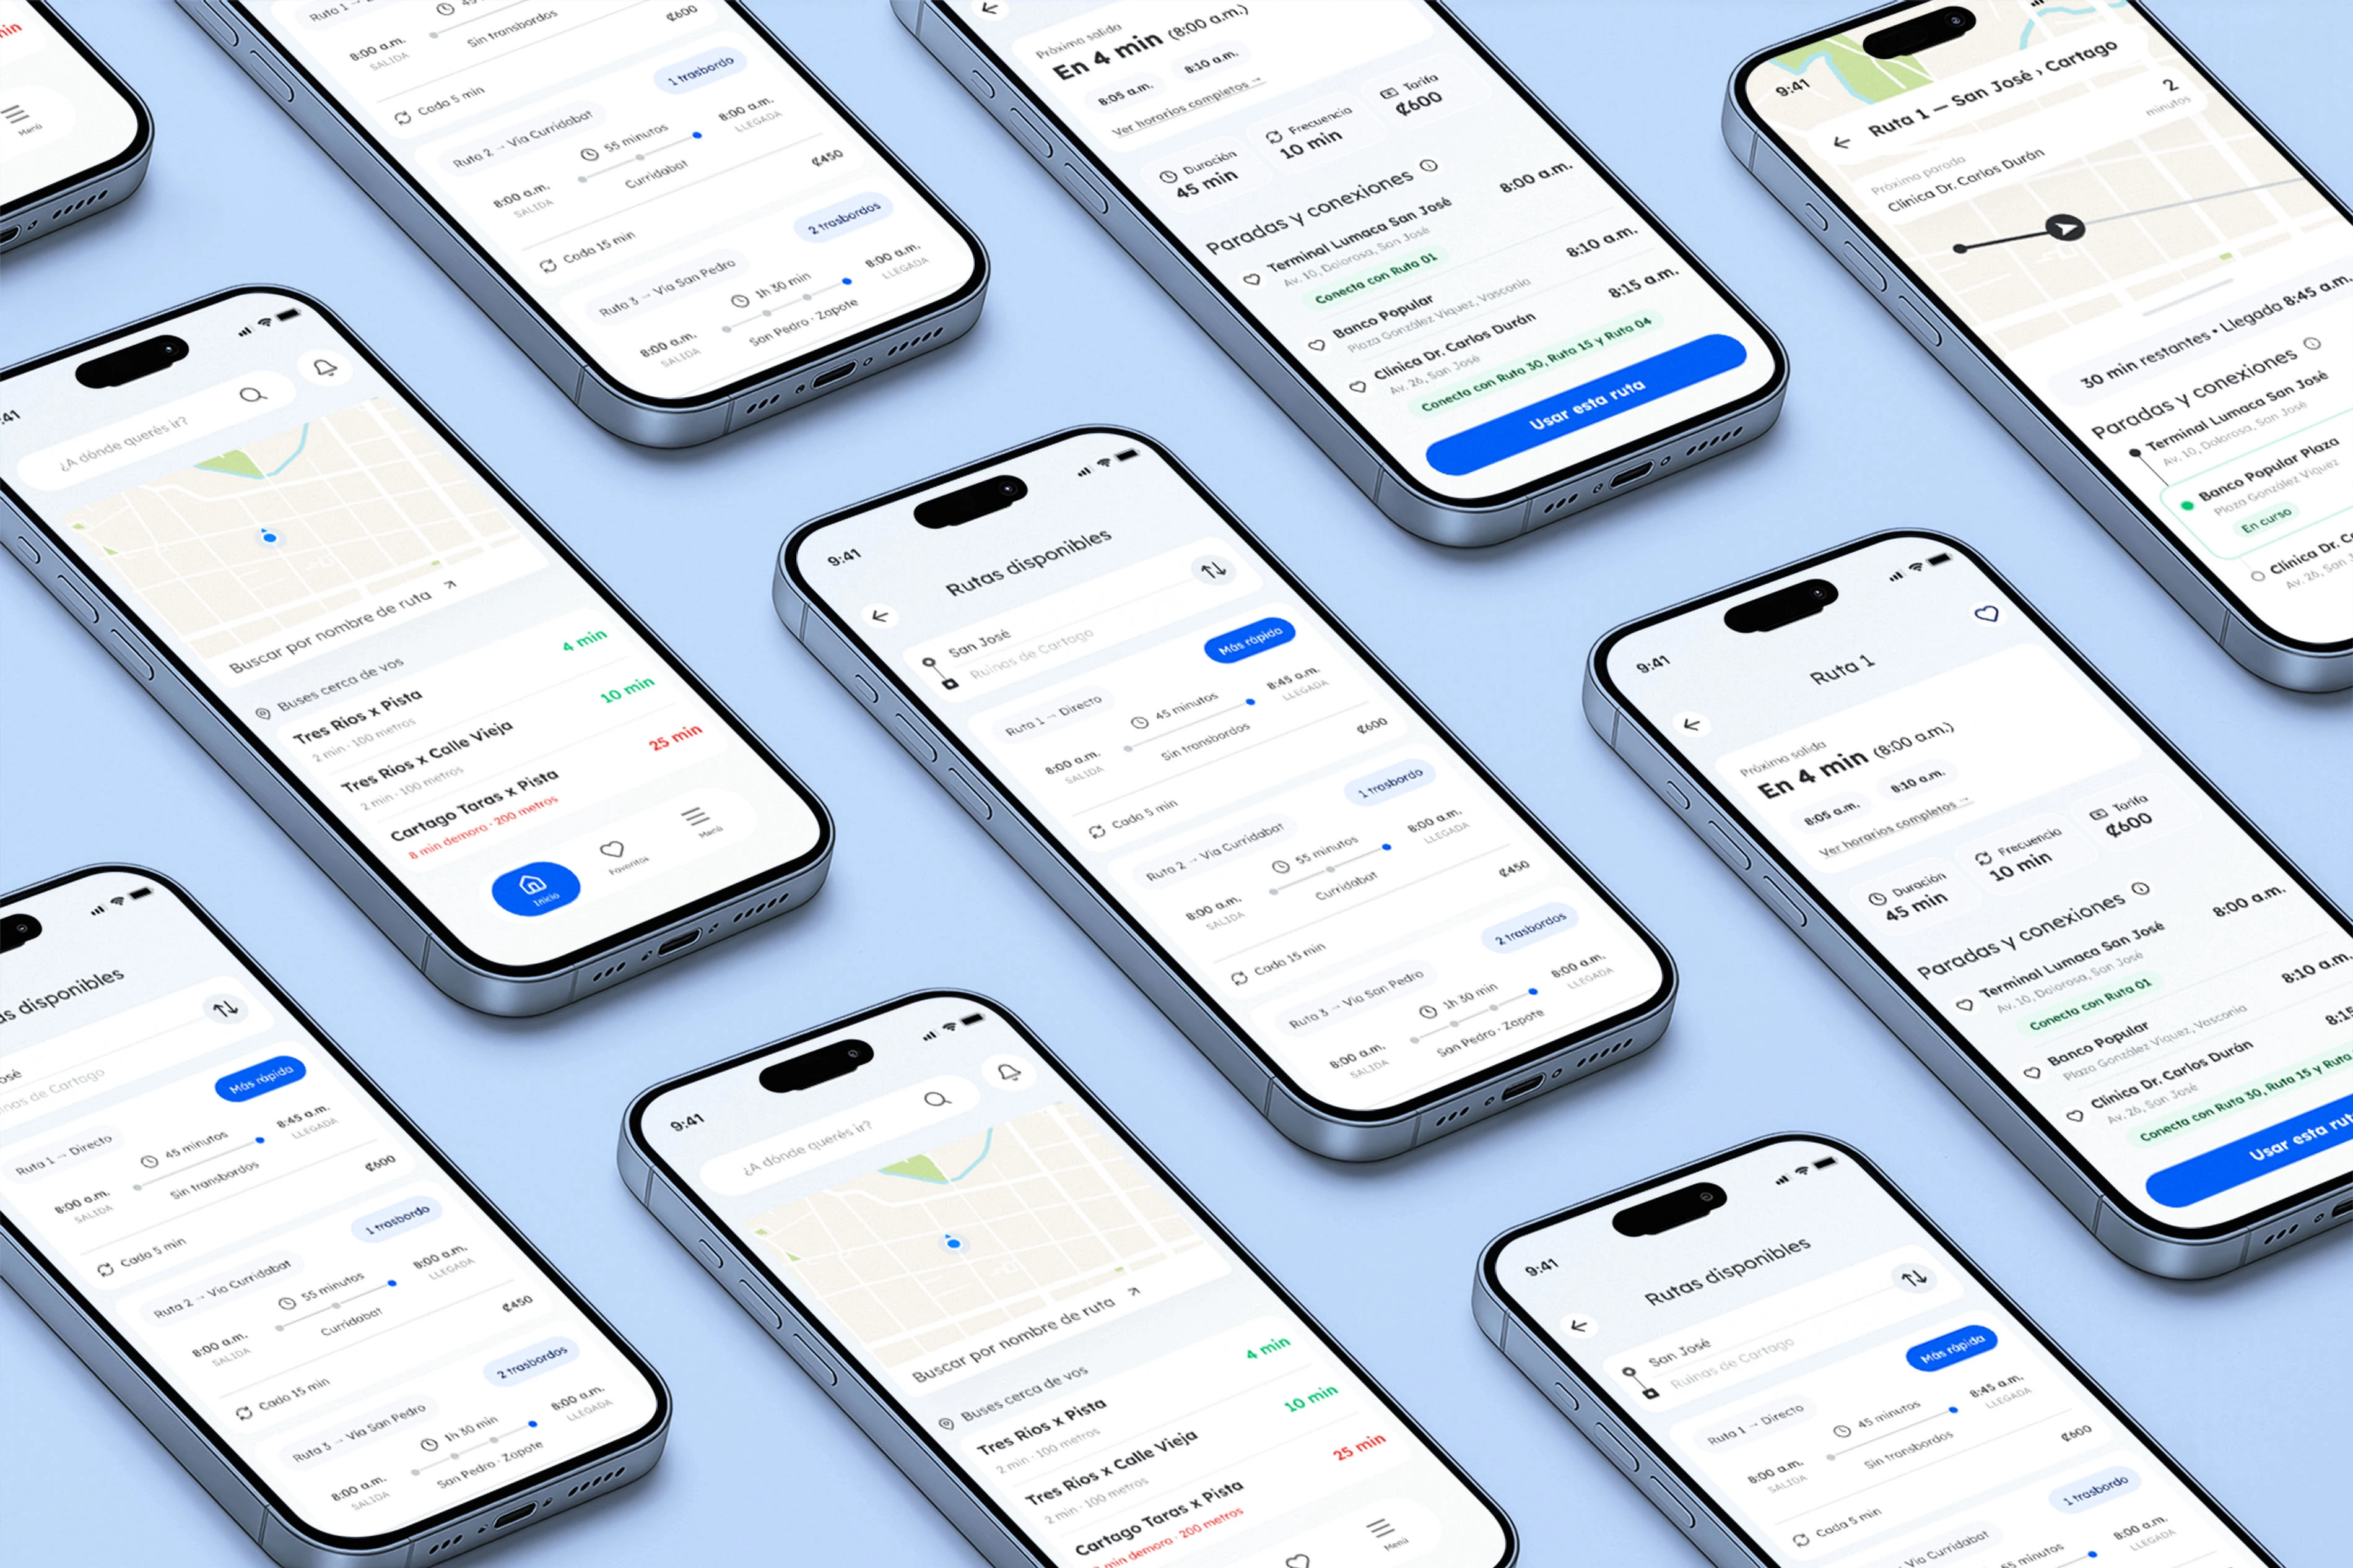
The visual direction was designed to communicate trust and reliability through a modern, technology-driven interface, contrasting with the uncertainty of the existing public transportation experience.